All dashboards are made up of gadgets that can be dragged onto the dashboard and then moved around as required.
The following burndown gadgets are available in Enterprise Tester:
- Burndown Chart
- Risk
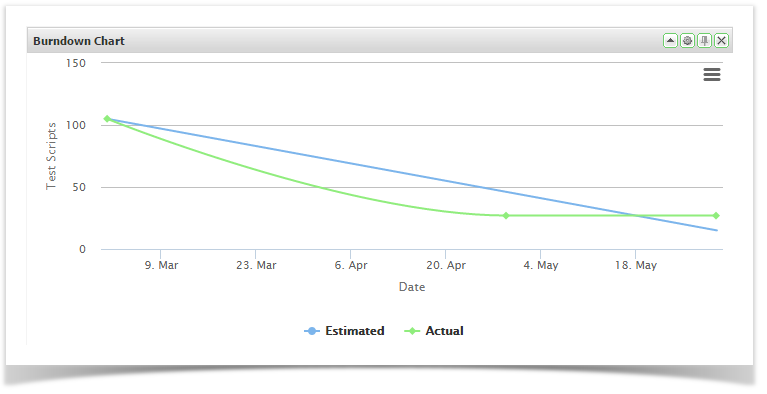
Burndown Chart
These allow you to view summary data from any of the saved queries you have created. You can create gadgets for either a specific execution set package/folder or for a specific set of data by using a saved query.
See Searching & TQL for information on how to create these queries.
- Drag and drop the Burndown Chart from the available gadgets onto your dashboard
- Click on the
 button to configure the portlet
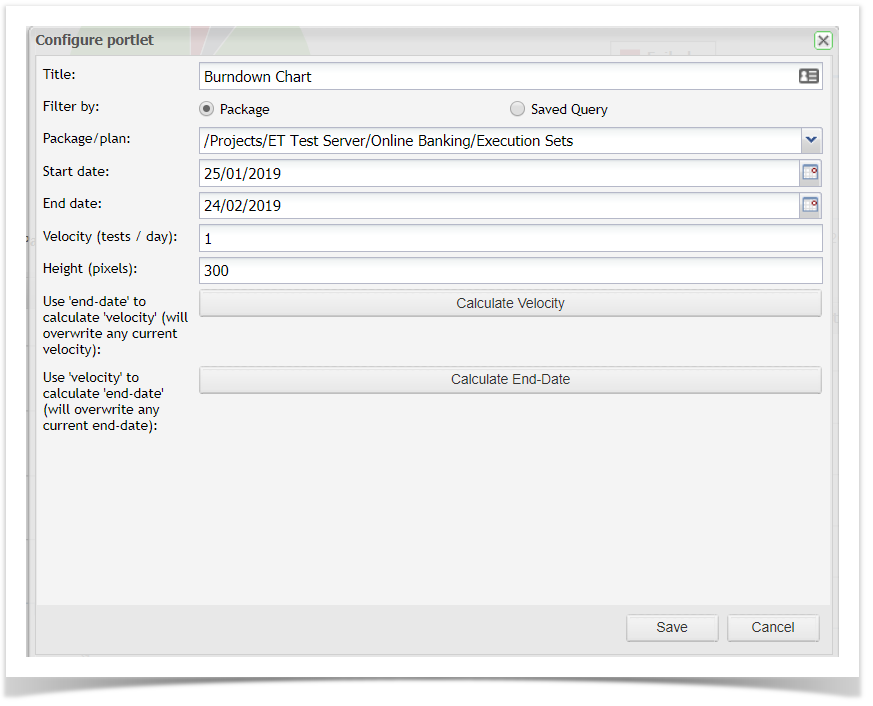
- Enter in a title for the chart. This will be displayed on the title bar of the gadget on your dashboard
- You can select the data you wish to chart by selecting either an execution set package or a saved query
- Enter in the start and end dates. By default these fields will default to today's date and the date one month later, respectively. You can leave the End Date blank , if you want to use Velocity (tests/day) to automatically calculate the End Date.
- OR you can enter an End Date and the Velocity will be automatically calculated by selecting the Calculate Velocity button. - You can select to change the height of the gadget. The height for all gadgets defaults to 300 pixels
- Once you have completed the fields, click on Save and the gadget will be displayed