You can set up dashboards to show summary information related to your test projects.
Dashboards are presented at three levels:
- My Dashboard
- Organization Dashboard
- Project Dashboards
Access your dashboards, you can either select the Dashboards tab or the Dashboards option on the User Menu.
Creating Dashboards
You can create new dashboards from the Manage Dashboards grid. Click on Add from the toolbar.
Enter the dashboard name on the Create New Dashboard dialog. You can then choose to either keep our dashboard private or to share with other users. If you plan to share your dashboard, in the View Only field, select the users and/ or groups you wish to provide access to from the dropdown. Note that once the dashboard is shared any user can select to be come the owner of the dashboard. Only owners can add and configure portlets.
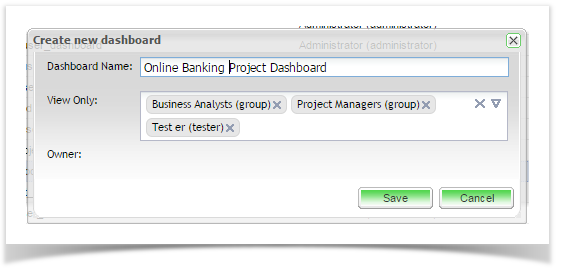
Click on Save to create your new dashboard.
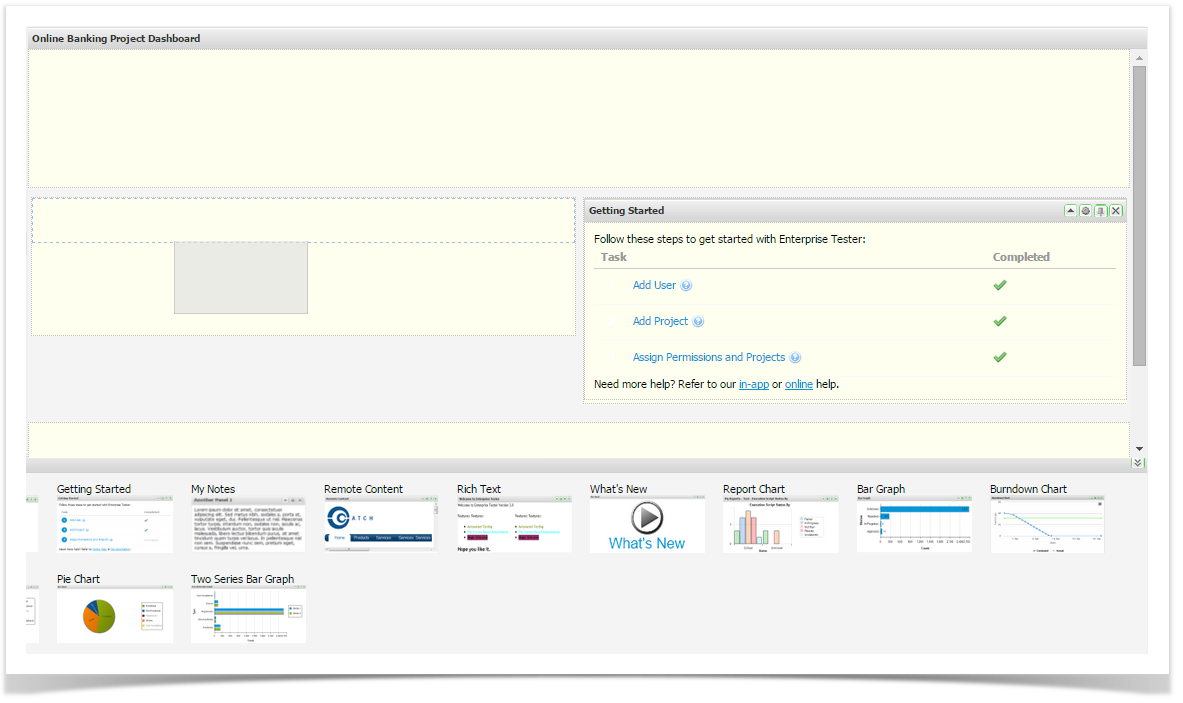
Customizing Dashboards
New dashboards are blank and ready for your to customize using the available portlets. Portlets can be dropped onto the dashboard and then moved around as required.
Enterprise Tester has many Portlets:
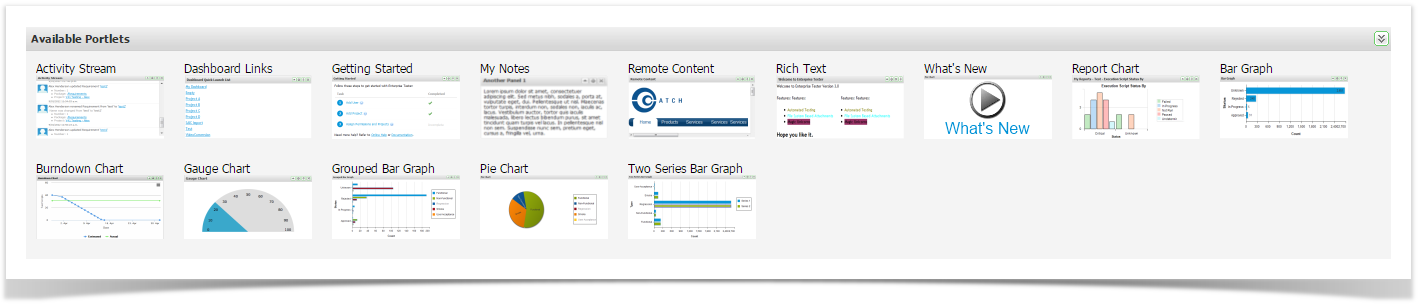
Activity Streams | Allows events to be posted to the dashboard |
Dashboard Links | Allows fast access to other dashboards |
My Notes | Allows you to add notes to the Dashboard |
Remote Content | Allows the display of content from a URL page |
Rich Text | Allows editable content using a rich text editor |
Report Chart | Classic Reports - displays charts form any of the configured reports |
Bar Graph | Displays a graph from underlying saved search/query criteria |
| Burndown Chart | Displays the actual versus estimated work remaining over time |
Gauge Chart | Displays a chart from underlying saved search/query criteria |
Grouped Bar Graph | Displays a graph from underlying saved search/query criteria |
Pie Chart | Displays a chart from underlying saved search/query criteria |
Two Series Bar Graph | Displays a graph from underlying saved search/query criteria |
To add a portlet to your dashboard:
- Drag the required portlet onto your dashboard.
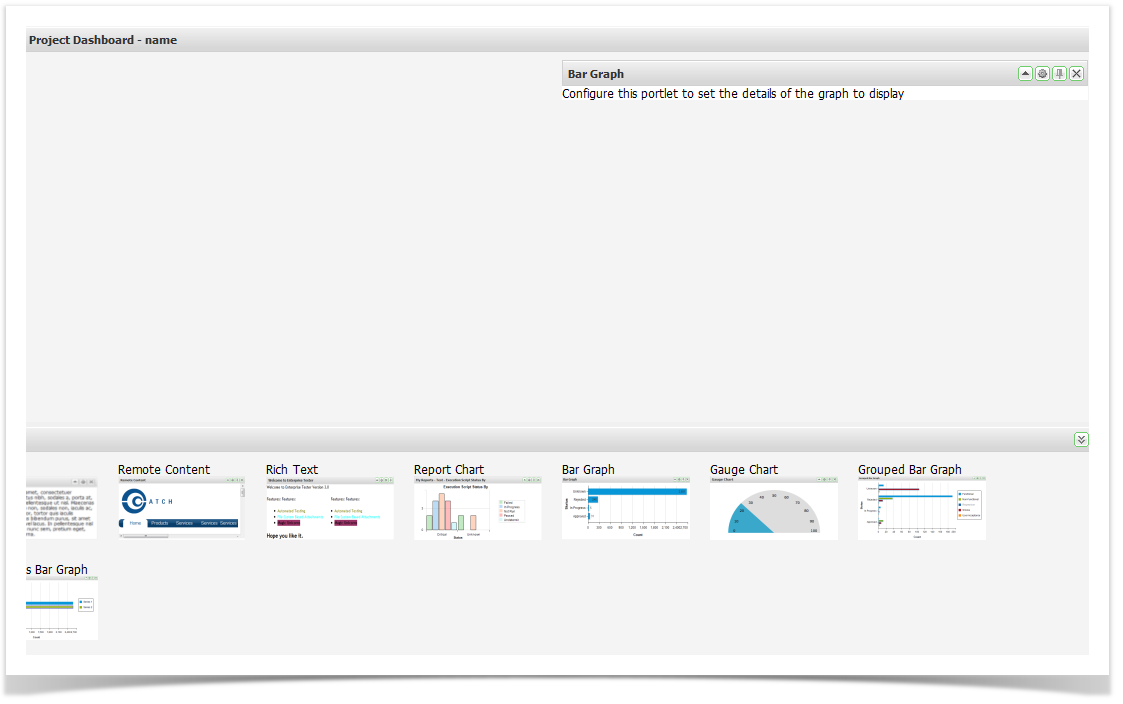
- When a blue zone is displayed, release the portlet to add it to the screen.