All dashboards are are made up of Portlets gadgets that can be dragged onto the dashboard and then moved around as required.
The following over time portlets gadgets are available in Enterprise Tester:
- Actual vs Estimated TimeBurndown Chart
- Incident Numbers
- Incident Rate
- Tests Completed
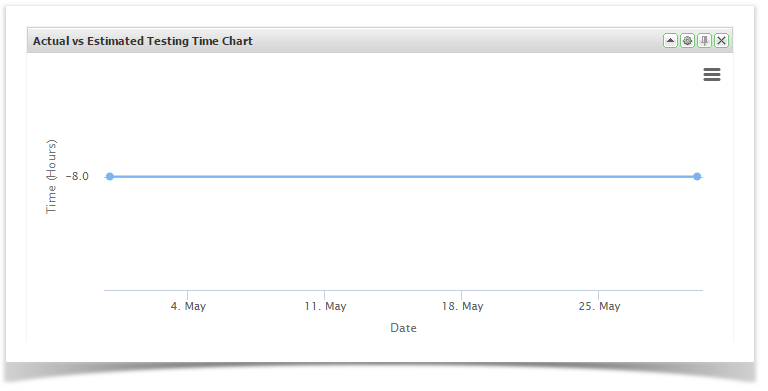
Actual vs Estimated Time
These allow you to view summary data from any of the saved queries you have created. You can create portlets gadgets for either a specific execution set package / folder or for a specific set of data by using a saved query.
See Searching & TQL for information on how to create these queries.
- Drag and drop Actual vs Estimated Time from the available portlets gadgets onto your workspace
- Click on the Configuration button the
button to configure the portlet and enter the required configuration
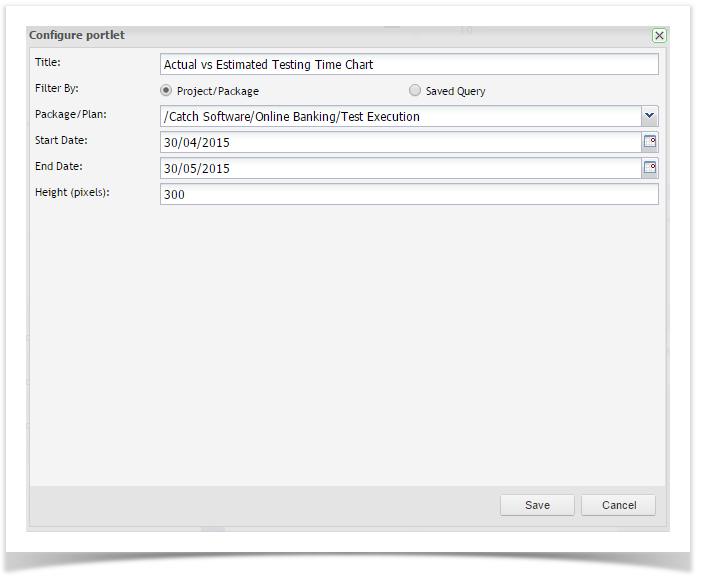
- Click Save
Burndown Chart
These allow you to view summary data from any of the saved queries you have created. You can create portlets for either a specific execution set package/folder or for a specific set of data by using a saved query.
See Searching & TQL for information on how to create these queries.
...
...
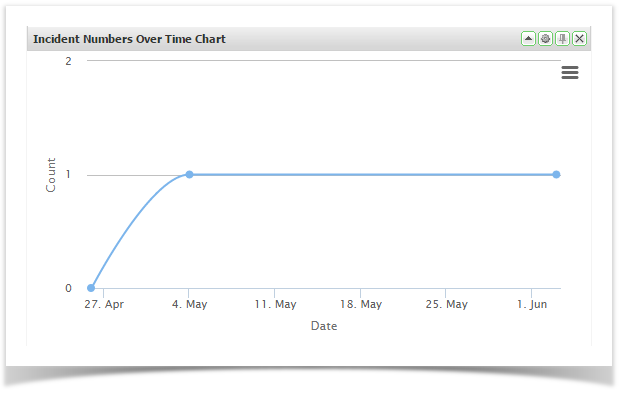
Incident Numbers Over Time
These allow you to view summary data from any of the saved queries you have created. You can create portlets gadgets for either a specific execution set package/folder or for a specific set of data by using a saved query.
See Searching & TQL for information on how to create these queries.
- Drag and drop Incident Numbers from the available portlets gadgets onto your workspace
- Click on the Configuration button
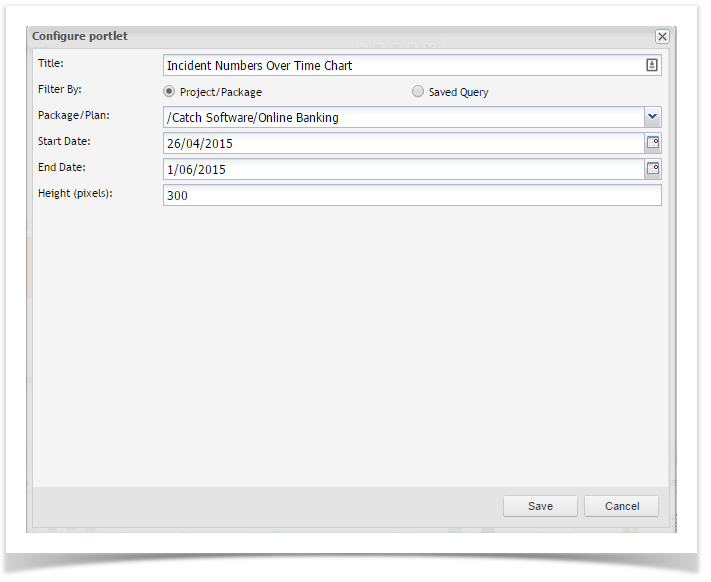
- Click Save
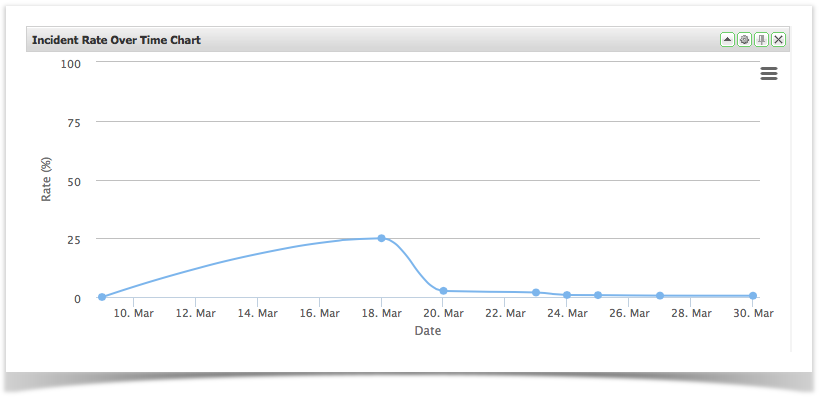
Incident Rate Over Time
These allow you to view summary data from any of the saved queries you have created. You can create portlets gadgets for either a specific execution set package/folder or for a specific set of data by using a saved query.
See Searching & TQL for information on how to create these queries.
- Drag and drop Incident Rate from the available portlets gadgets onto your workspace
- Click on the Configuration button the
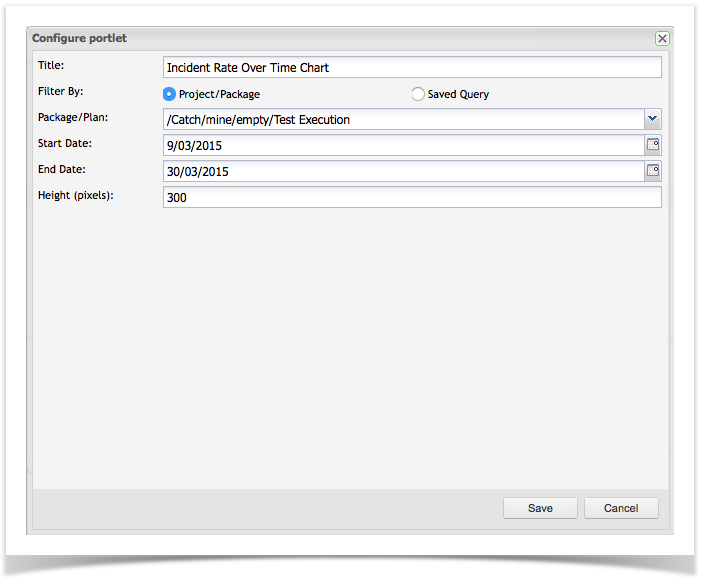
- Click Save
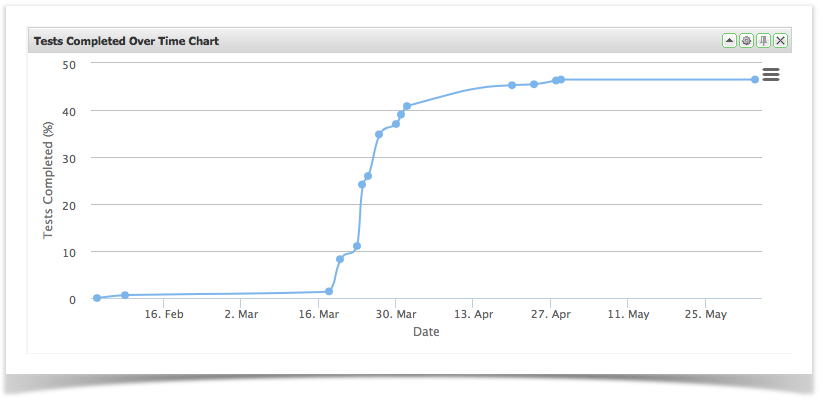
Tests Completed Over Time
These allow you to view summary data from any of the saved queries you have created. You can create portlets gadgets for either a specific execution set package/folder or for a specific set of data by using a saved query.
See Searching & TQL for information on how to create these queries.
- Drag and drop Tests Completed from the available portlets gadgets onto your workspace
- Click on the Configuration button
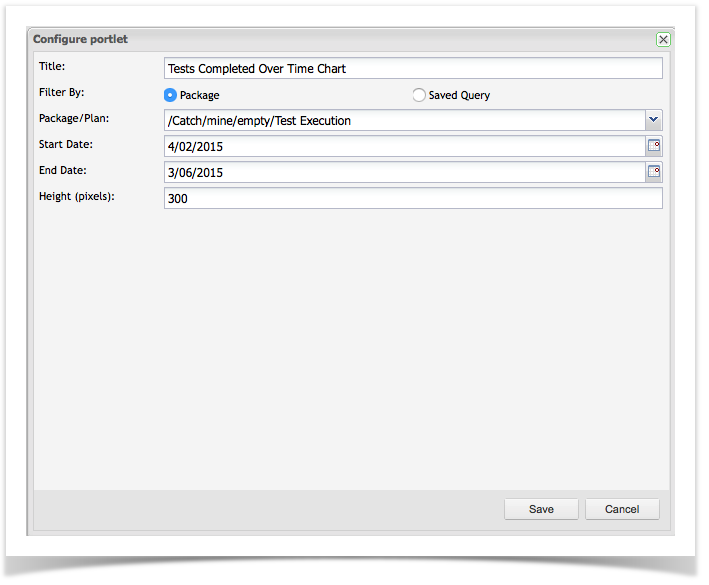
- Click Save