Dashboards can be established to display summary information at any level within Enterprise Tester.
Creating Dashboards
- Select Dashboards from the toolbar or Dashboards tab or Dashboards option on the User Profile Menu, Manage Dashboards grid is displayed.
- Click Add from the toolbar.
- Enter the Dashboard Name.
- Share your dashboard if required. In the View Only field, select the users and/ or groups you wish to provide access.
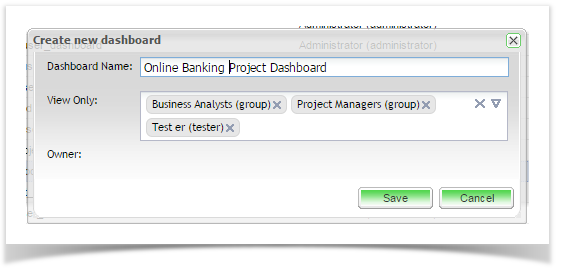
- Click Save to create your new dashboard.
| Info | ||
|---|---|---|
| ||
Only owners can edit dashboard information. Once the dashboard is shared then any user can then take Ownership of it. |
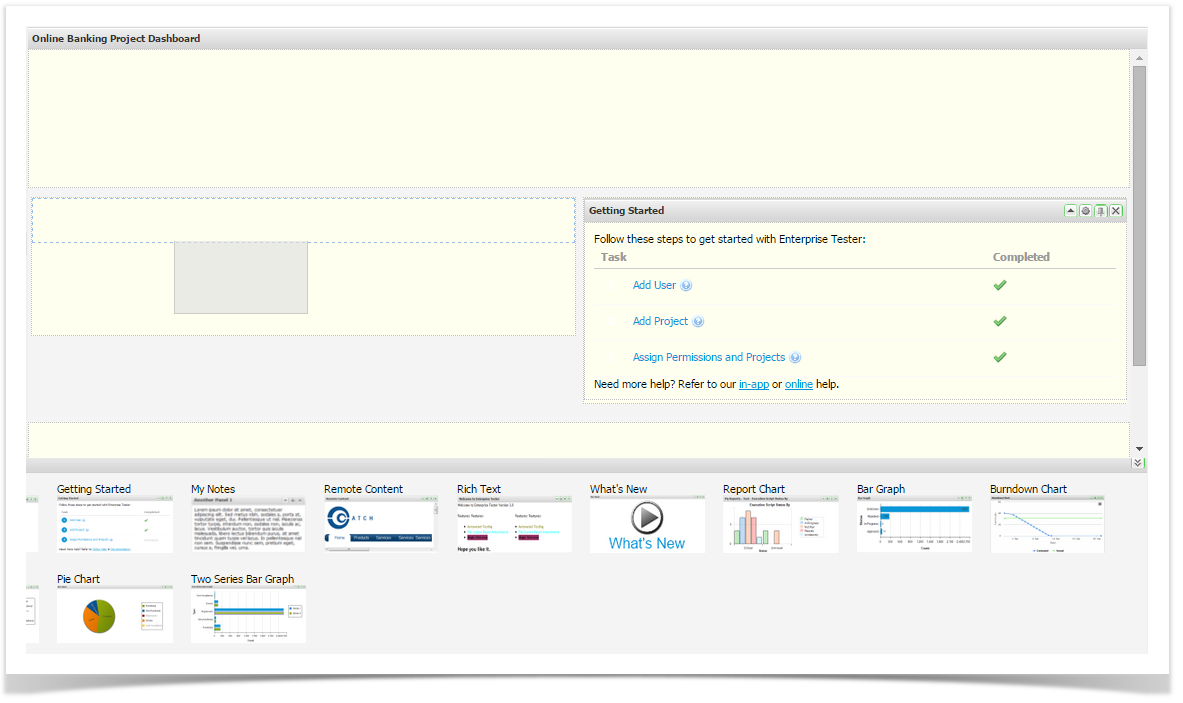
Adding to your Dashboard
Once the dashboard is created, gadgets can be dropped onto the dashboard and moved around as required.
- Access available gadgets by clicking the double arrow on the bottom right hand side of the screen.
- Drag the required gadget onto your dashboard.
- When a blue zone is displayed, release the gadget to drop it on the screen.
See details on specific dashboard graphs here:
| Children Display |
|---|
Portlet Output and Printing
For all portlets except the "Report Chart" portlet you you can create JPEG or PNG output or create Print output.
...
- Click the hamburger (three horizontal lines) in the top right hand corner on the chart.
- Select one of the following options - Print, JPEG or PNG options.
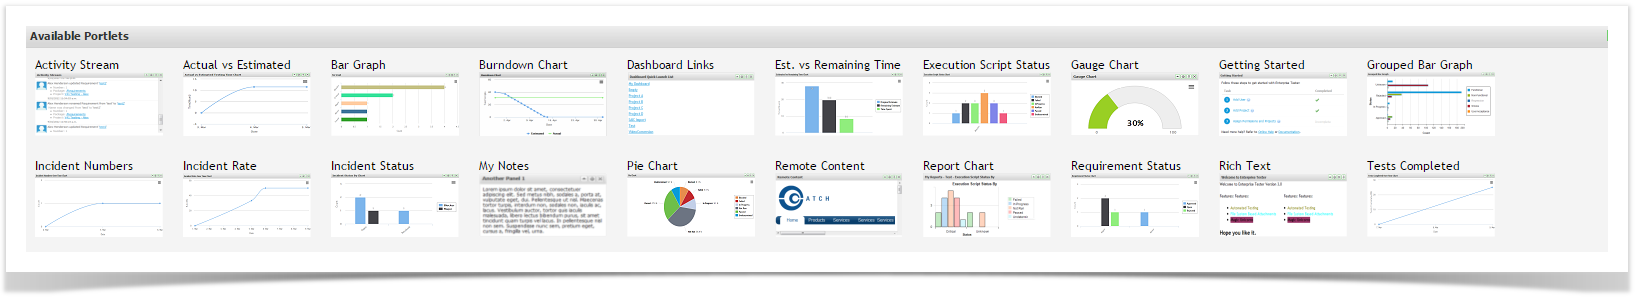
Enterprise Tester Gadget listing
Activity Streams | Allows events to be posted to the dashboard | ||
| Actual vs Estimated | Displays the actual versus estimated duration for script execution | ||
| Bar Graph | Displays a graph from underlying saved search/query criteria | ||
| Burndown Chart | Displays the actual versus estimated work remaining over time | ||
Dashboard Links | Allows fast access to other dashboards | ||
| Est vs Remaining Time | Displays the estimated versus remaining duration for script execution | ||
| Execution Script Status | Displays execution status from underlying saved search/query criteria | ||
| Gauge Chart | Displays a chart from underlying saved search/query criteria | ||
| Getting Started | Links to getting started tasks | ||
| Grouped Bar Graph | Displays a graph from underlying saved search/query criteria | ||
| Incident Numbers | Displays a graph of Incident Numbers over time | ||
| Incident Rate | Displays a graph of Incident Rate over time | ||
| Incident Status | Displays a graph of Incident Statuses | ||
My Notes | Allows you to add plain-text notes to the Dashboard | ||
| Pie Chart | Displays a chart from underlying saved search/query criteria | ||
Remote Content | Allows the display of content from a URL page | ||
| Report Chart | Classic Reports - displays charts form any of the configured reports | ||
| Requirement Status | Displays a graph of Requirement Status | ||
Rich Text | Allows editable content using a rich text editor | ||
Tests Completed | Displays a graph of Tests Completed | ||
Total Scripts Run | Displays a graph of Total Scripts Run | ||
Two Series Bar Graph | Displays a graph from underlying saved search/query criteria | What's New | Enterprise Tester 'What's New' video