Dashboards can be established to display summary information at any level within Enterprise Tester.
Creating Dashboards
You can set up dashboards to show summary information related to your projects or for your organization overall.
...
- Select Dashboards from the toolbar or
- Dashboards option on the User
...
Creating Dashboards
...
- Profile Menu, Manage Dashboards grid is displayed.
...
- Click Add from the toolbar.
- Enter
...
- the
...
- Dashboard Name.
- Share your dashboard if required. In
...
- the View Only field, select the users and/ or groups you wish to provide access
...
- .
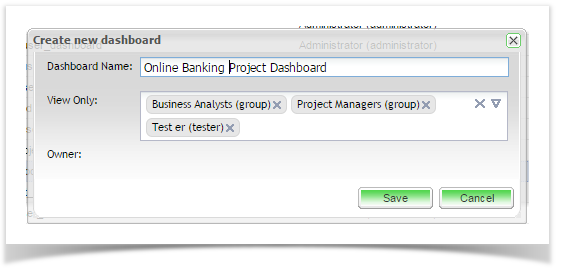
- Click Save to create your new dashboard.
| Info | ||
|---|---|---|
| ||
Only owners can edit dashboard information. Once the dashboard is shared then any user can then take |
...
Ownership of |
...
it. |
...
Adding to
...
your
...
Customizing Dashboards
Dashboard
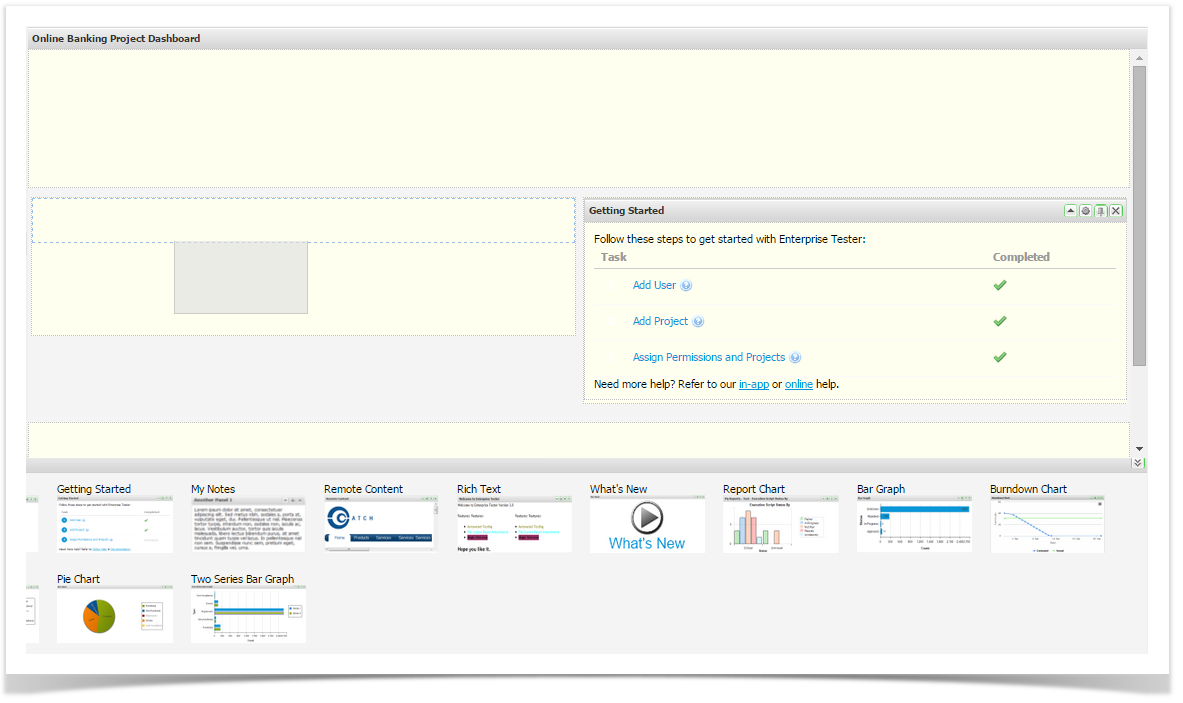
Once the dashboard is created, gadgets New dashboards are blank and ready for your to customize using the available portlets. Portlets can be dropped onto the dashboard and then moved around as required.Portlets are accessed
- Access available gadgets by clicking
...
- the double arrow on the bottom right hand side of the screen.
- Drag the required gadget onto your dashboard.
- When a blue zone is displayed, release the gadget to drop it on the screen.
See details on specific dashboard graphs here:
| Children Display |
|---|
Portlet Output and Printing
For all portlets except the "Report Chart" you can create JPEG or PNG output or create Print output.
![]() You must have internet access for the outputs to render.
You must have internet access for the outputs to render.
- Click the hamburger (three horizontal lines) in the top right hand corner on the chart.
- Select one of the following options - Print, JPEG or PNG.
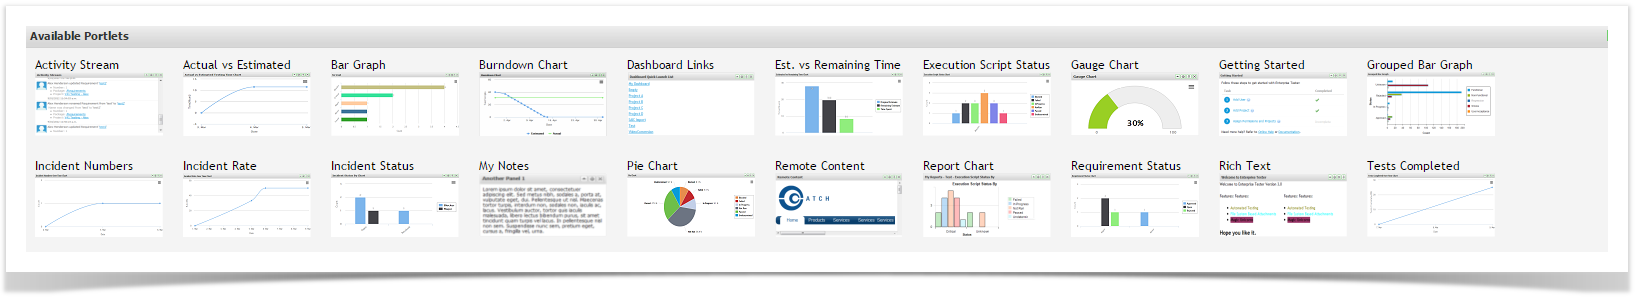
Enterprise Tester Gadget listing
Enterprise Tester has many Portlets:
...
Portlet Output and Printing
For all portlets except the "Report Chart" portlet you can create JPEG or PNG output or create Print output. ![]() You must have internet access for the outputs to render.
You must have internet access for the outputs to render.
...
Activity Streams | Allows events to be posted to the dashboard |
| Actual vs Estimated | Displays the actual versus estimated duration for script execution |
| Bar Graph | Displays a graph from underlying saved search/query criteria |
| Burndown Chart | Displays the actual versus estimated work remaining over time |
Dashboard Links | Allows fast access to other dashboards |
| Est vs Remaining Time | Displays the estimated versus remaining duration for script execution |
| Execution Script Status | Displays execution status from underlying saved search/query criteria |
| Gauge Chart | Displays a chart from underlying saved search/query criteria |
| Getting Started | Links to getting started tasks |
| Grouped Bar Graph | Displays a graph from underlying saved search/query criteria |
| Incident Numbers | Displays a graph of Incident Numbers over time |
| Incident Rate | Displays a graph of Incident Rate over time |
| Incident Status | Displays a graph of Incident Statuses |
My Notes | Allows you to add plain-text notes to the Dashboard |
| Pie Chart | Displays a chart from underlying saved search/query criteria |
Remote Content | Allows the display of content from a URL page |
| Report Chart | Classic Reports - displays charts form any of the configured reports |
| Requirement Status | Displays a graph of Requirement Status |
Rich Text | Allows editable content using a rich text editor |
Tests Completed | Displays a graph of Tests Completed |
Total Scripts Run | Displays a graph of Total Scripts Run |
Two Series Bar Graph | Displays a graph from underlying saved search/query criteria |
| What's New | Enterprise Tester 'What's New' video |
Add Portlets to your Dashboard
To add a portlet to your dashboard:
...