| Panel | ||||||
|---|---|---|---|---|---|---|
Test Execution
Rover provides you with the ability to run tests from Enterprise Tester when you are on the go - working in remote locations, or in areas where internet connectivity is unreliable or unavailable. Rover supports synchronizing both script assignments and incidents with Enterprise Tester. |
...
This article covers |
...
synchronizing and running script assignments. |
...
when performing the following;
|
...
|
...
|
...
The Getting Started |
...
article provides an introduction to help users become familiarized with Rover. Copying |
...
Scripts and Execution Sets to RoverAn internet connection is required for this task. After logging into Rover, and selecting a project, the navigator will display the execution set folders and their script assignments (but not their agile runs) in the |
...
selected project listed in the Enterprise Tester navigator. In Enterprise Tester: |
...
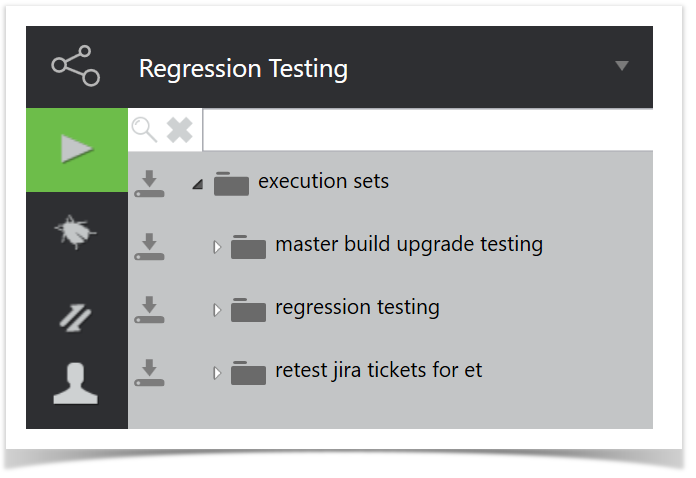
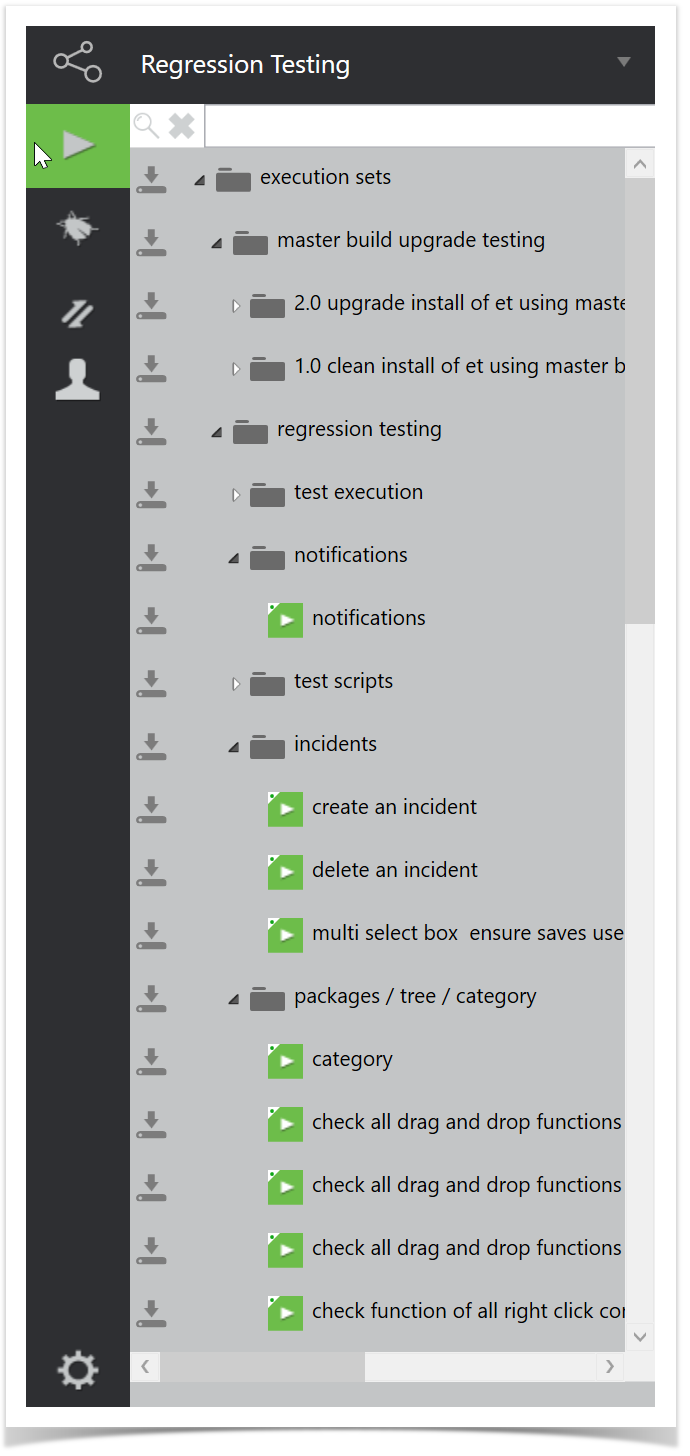
In Rover, the execution |
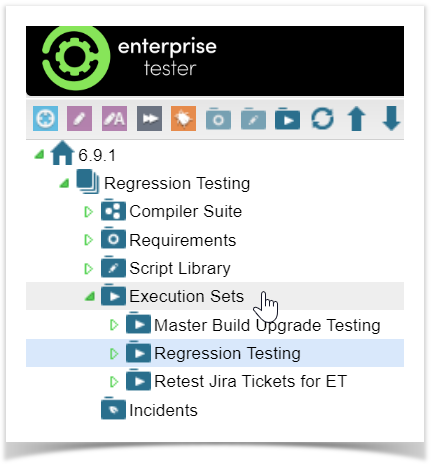
...
icon is highlighted in green and the packages and any script assignments of the |
...
selected project |
...
are displayed |
...
: |
...
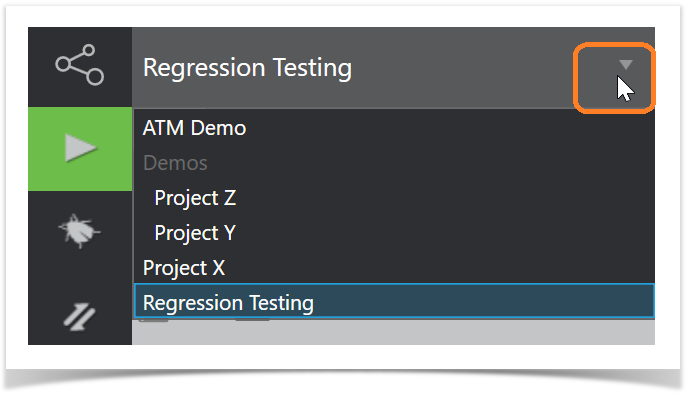
You can change the project by selecting from the drop down list. Projects are organised into categories, just like in |
...
Enterprise Tester. Users will only be able to see projects that are defined in their user permissions on the |
...
Enterprise Tester server. |
...
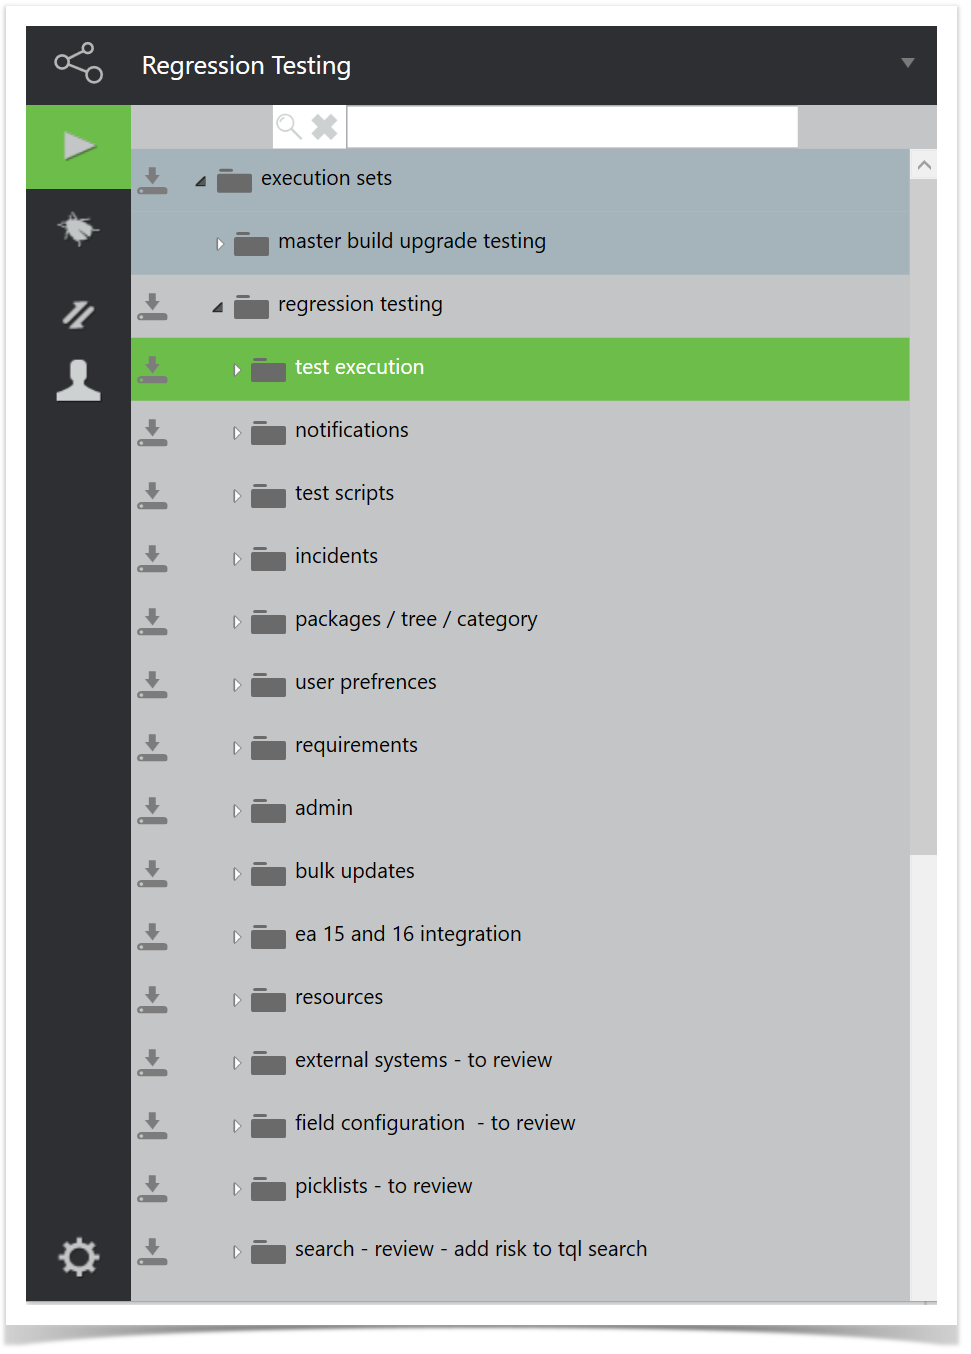
Once the project is selected, you can then review and select the execution sets |
...
you wish to download from |
...
Enterprise Tester server. |
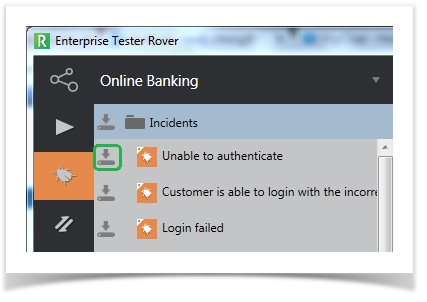
On the left select the tab with the bug icon to view all incidents in a project:
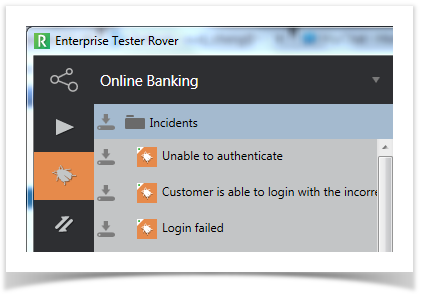
...
By default the folders are collapsed. The white
Execution sets and script assignments that have not yet been |
...
downloaded (or have been changed since you last downloaded) to your device will display the download icon |
...
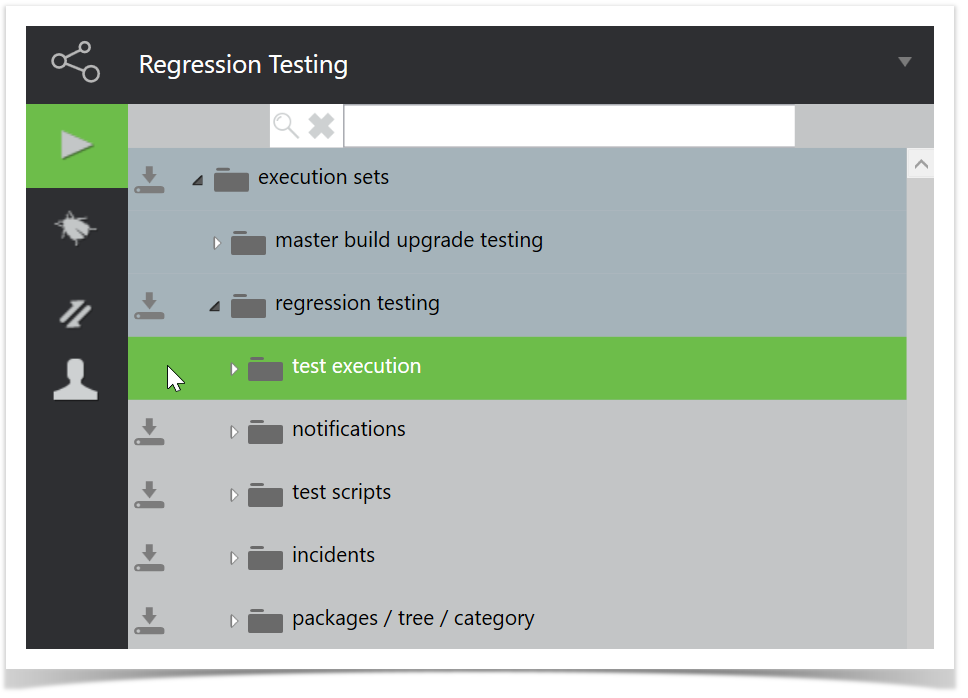
To download execution sets, click on the download icon for the folder or the individual script assignment you wish to download. |
You can also |
...
download all execution sets and script assignments by clicking |
...
on the |
...
download icon for the Execution Sets folder.
Once you have downloaded the execution set or the script assignment, the download icon will disappear.
|
...
You'll also notice that once a |
...
script assignment has been downloaded from the server to the client |
...
device, the script assignment icon will change from: |
...
|

...
server and has not been downloaded. |
...
to: |
...
|

...
device. You can view a list of all icons on the Entity Icon section of |
...
the Getting Started |
...
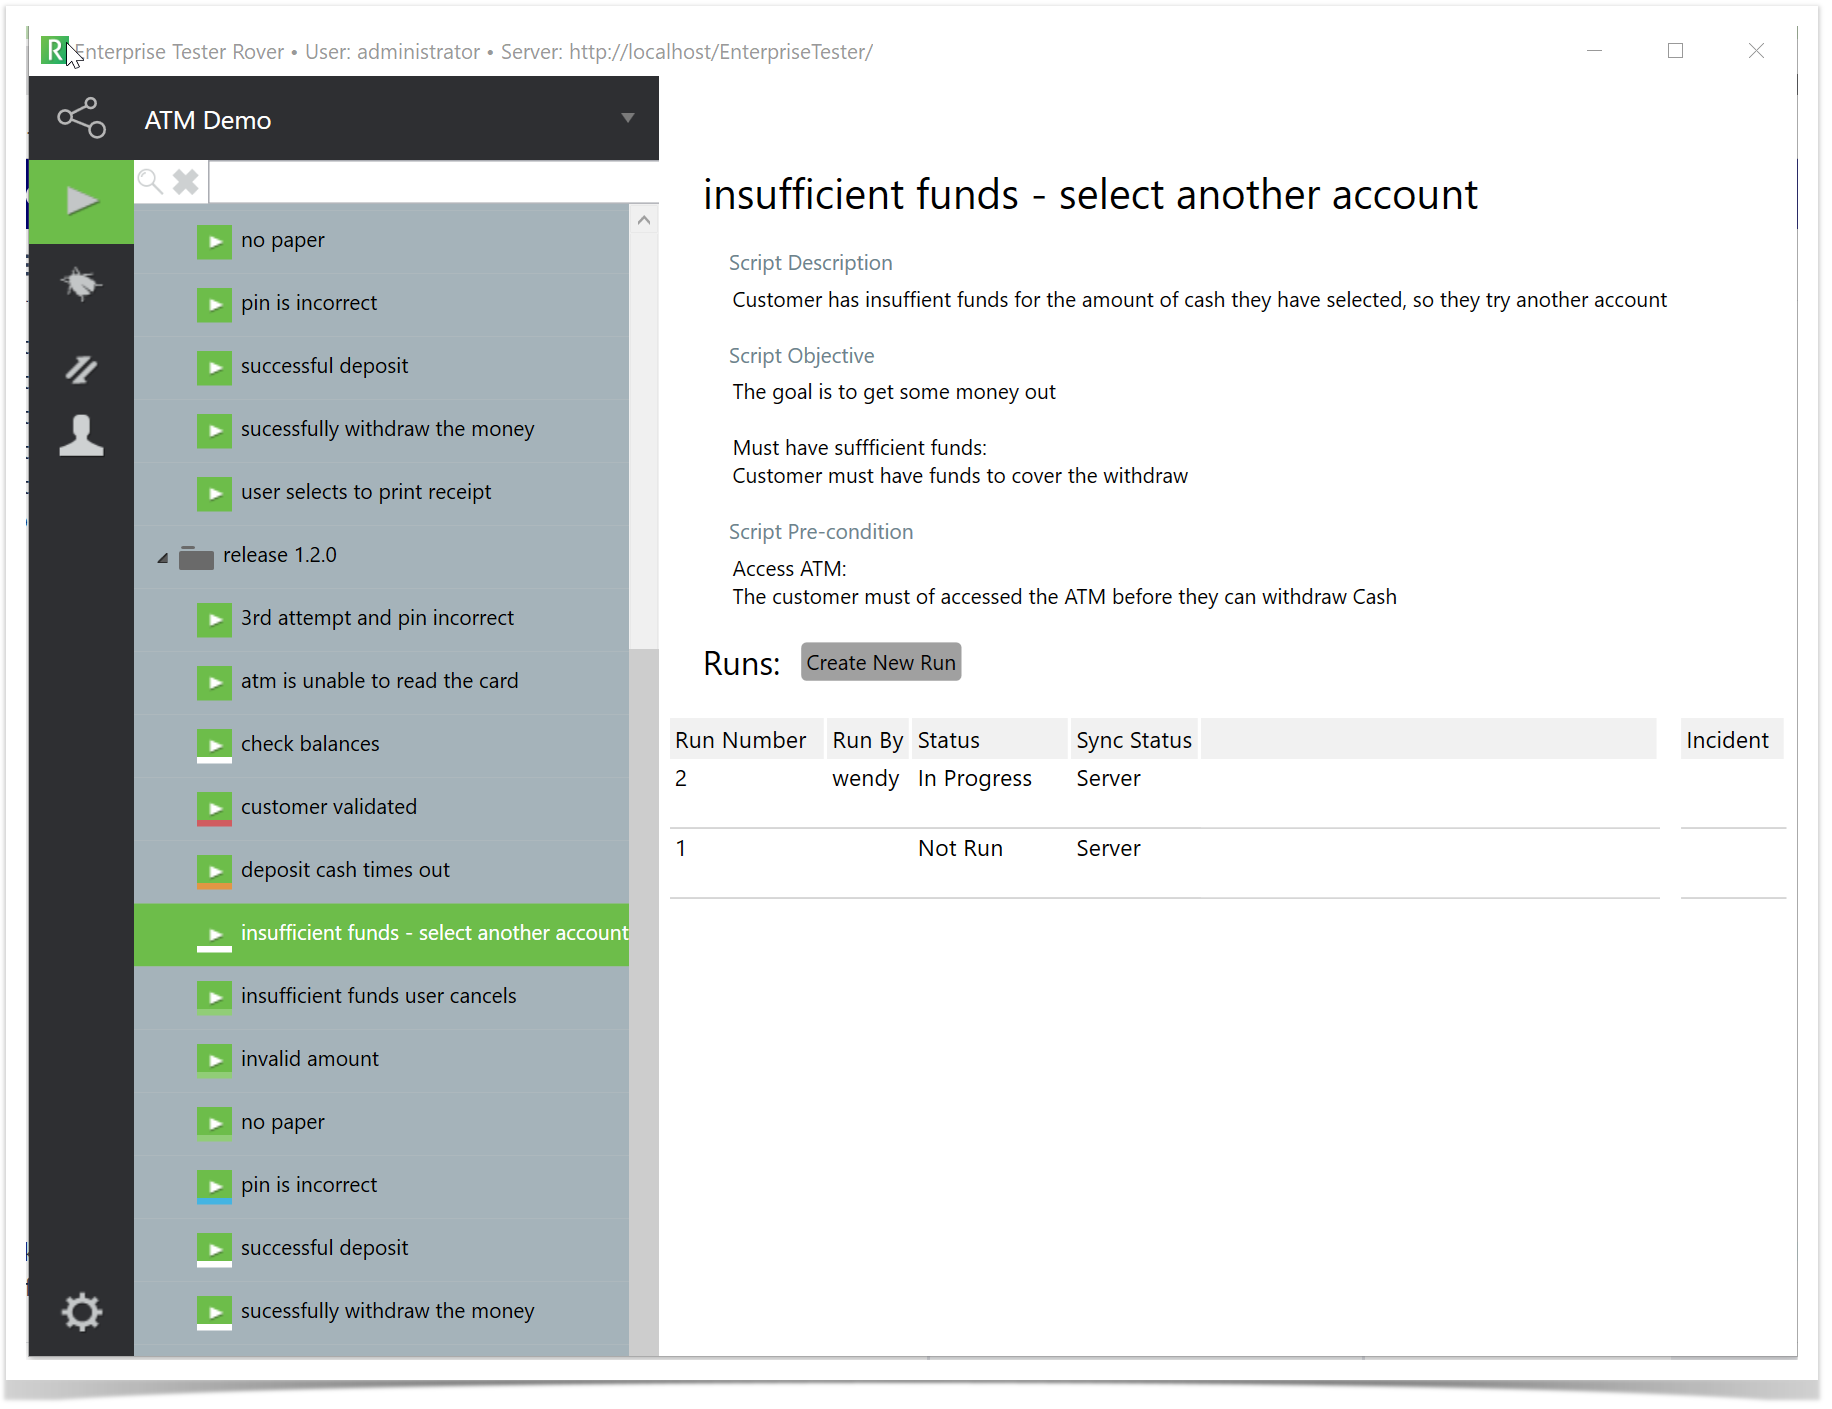
article. Viewing and Running TestsOnce you have downloaded your script assignments, depending on the machine or device you are using, you can click or tap on the script assignment in the tree view to view or run your script. The following fields will be displayed on the screen. If any of the fields are blank in Enterprise Tester then the fields will not be displayed in Rover when viewing.
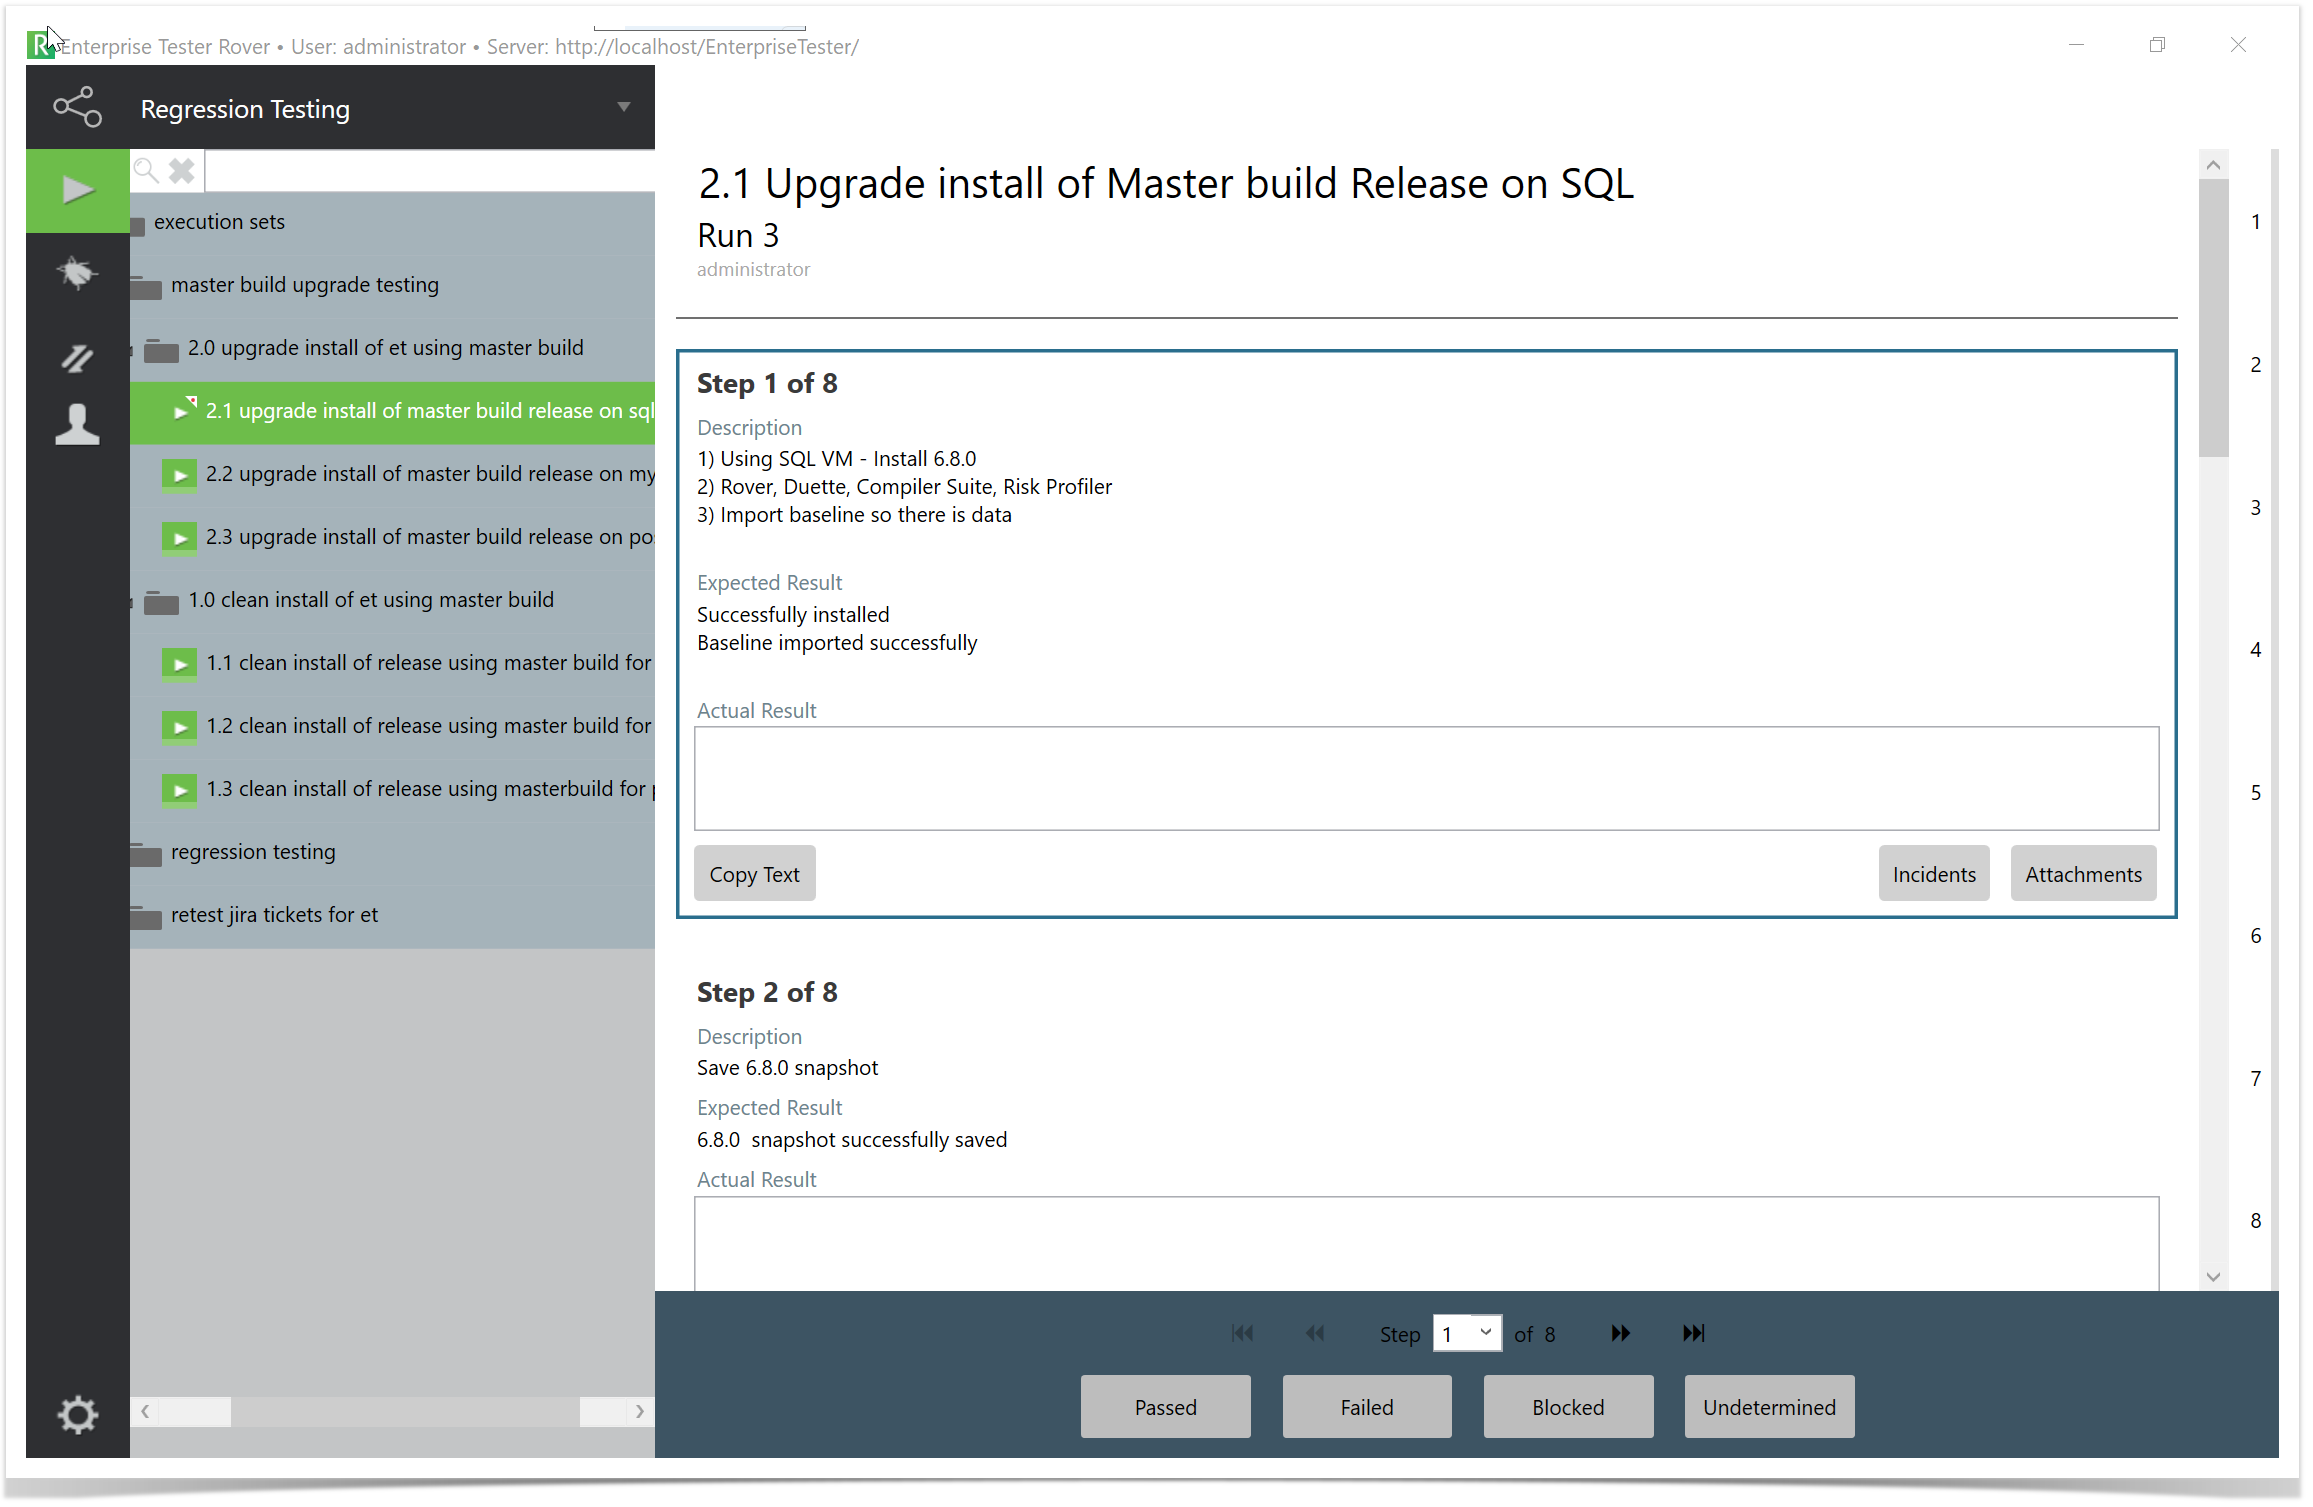
You can choose to view any of the previous runs on the run history grid. The run history grid will provide you with some basic details including the Run Number, the Run By details, the status of each run, the Sync Status and any Incidents associated to the Test Run. The sync status will tell you whether the run has been recorded on the server or whether it only resides locally. Starting a New RunYou can start a new run by selecting the Create New Run button located above the run history grid. This will load the run screen which will provide you with all the custom fields scoped for script assignments and you'll also see your steps in a list view. You'll also see:
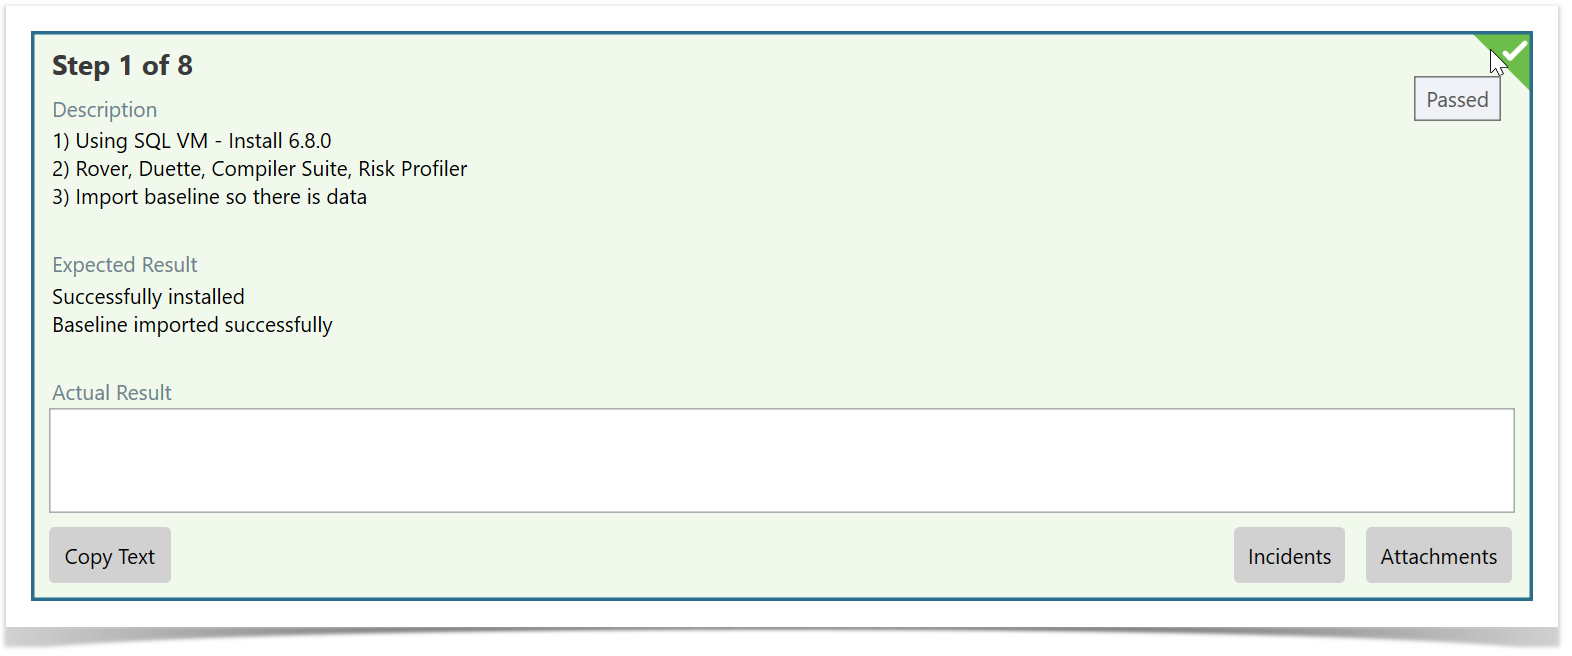
Similarly to executing a test run in Enterprise Tester, there is a text field for entering Actual Results. While a step is active you can select the step result at the bottom of the screen to set that step's status. If you Pass a step, the next step will automatically be selected, otherwise the actual result field will be focused so that you can start typing.
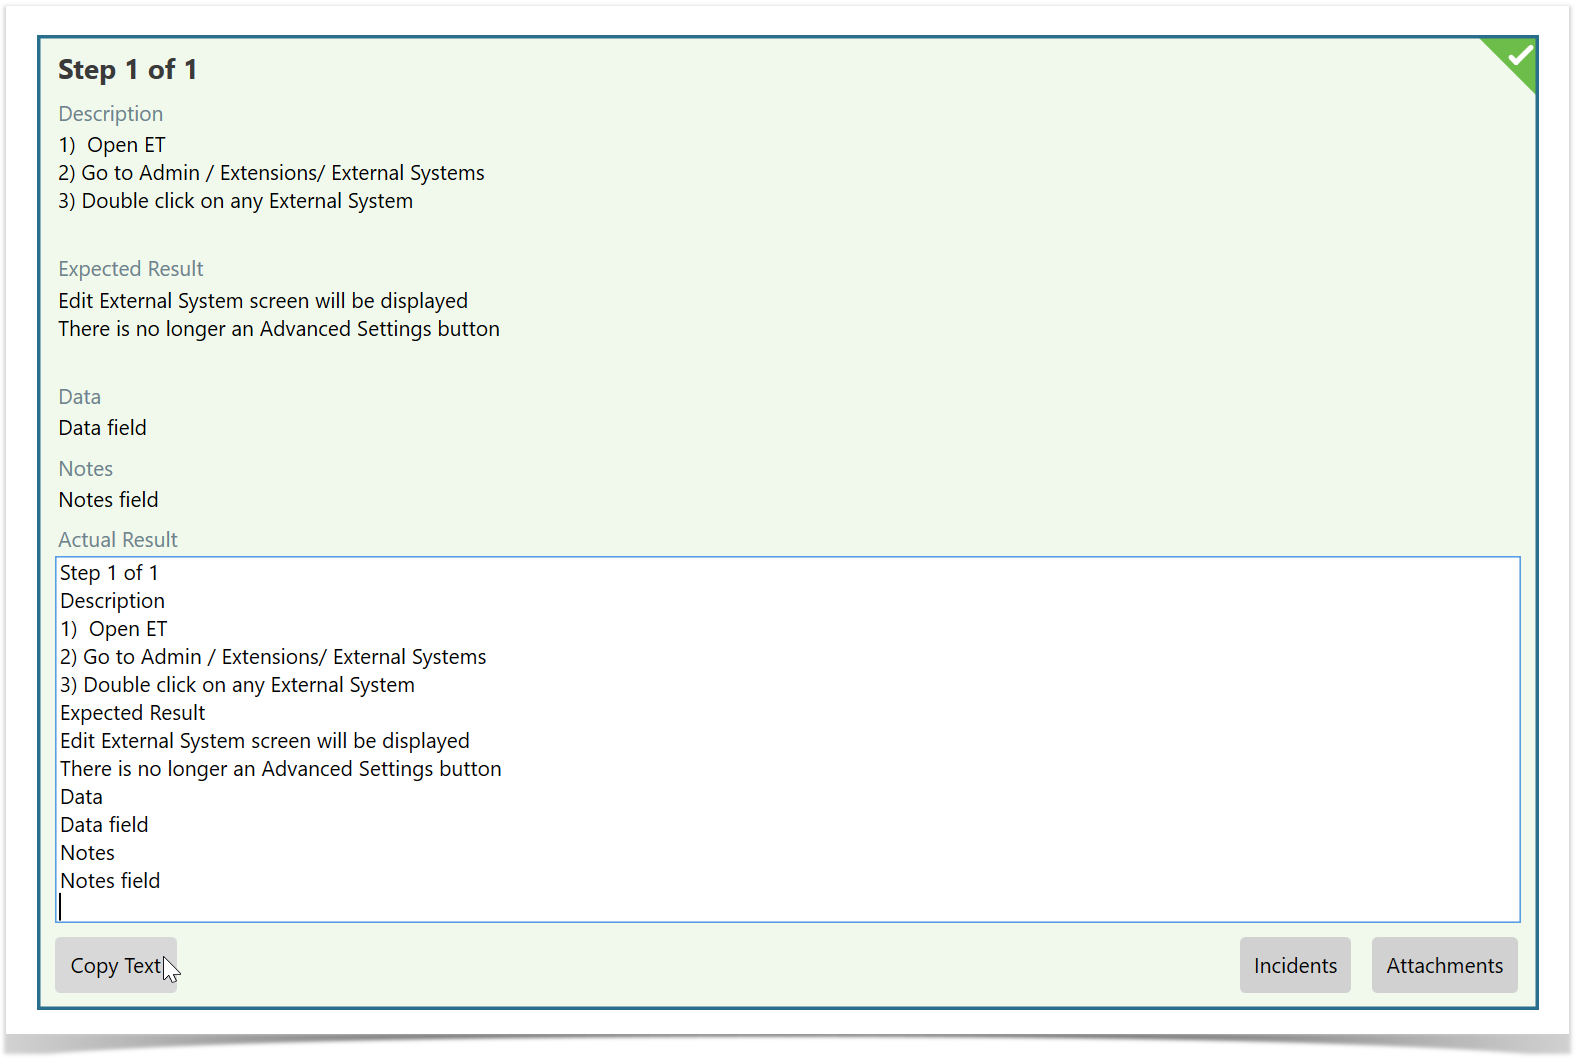
Rover allows copying and pasting text from another source i.e. Excel and pasting it into the Expected Result field (by using CTRL+V). You can also copy all of the Test Step details and paste them into the Expected Results field.
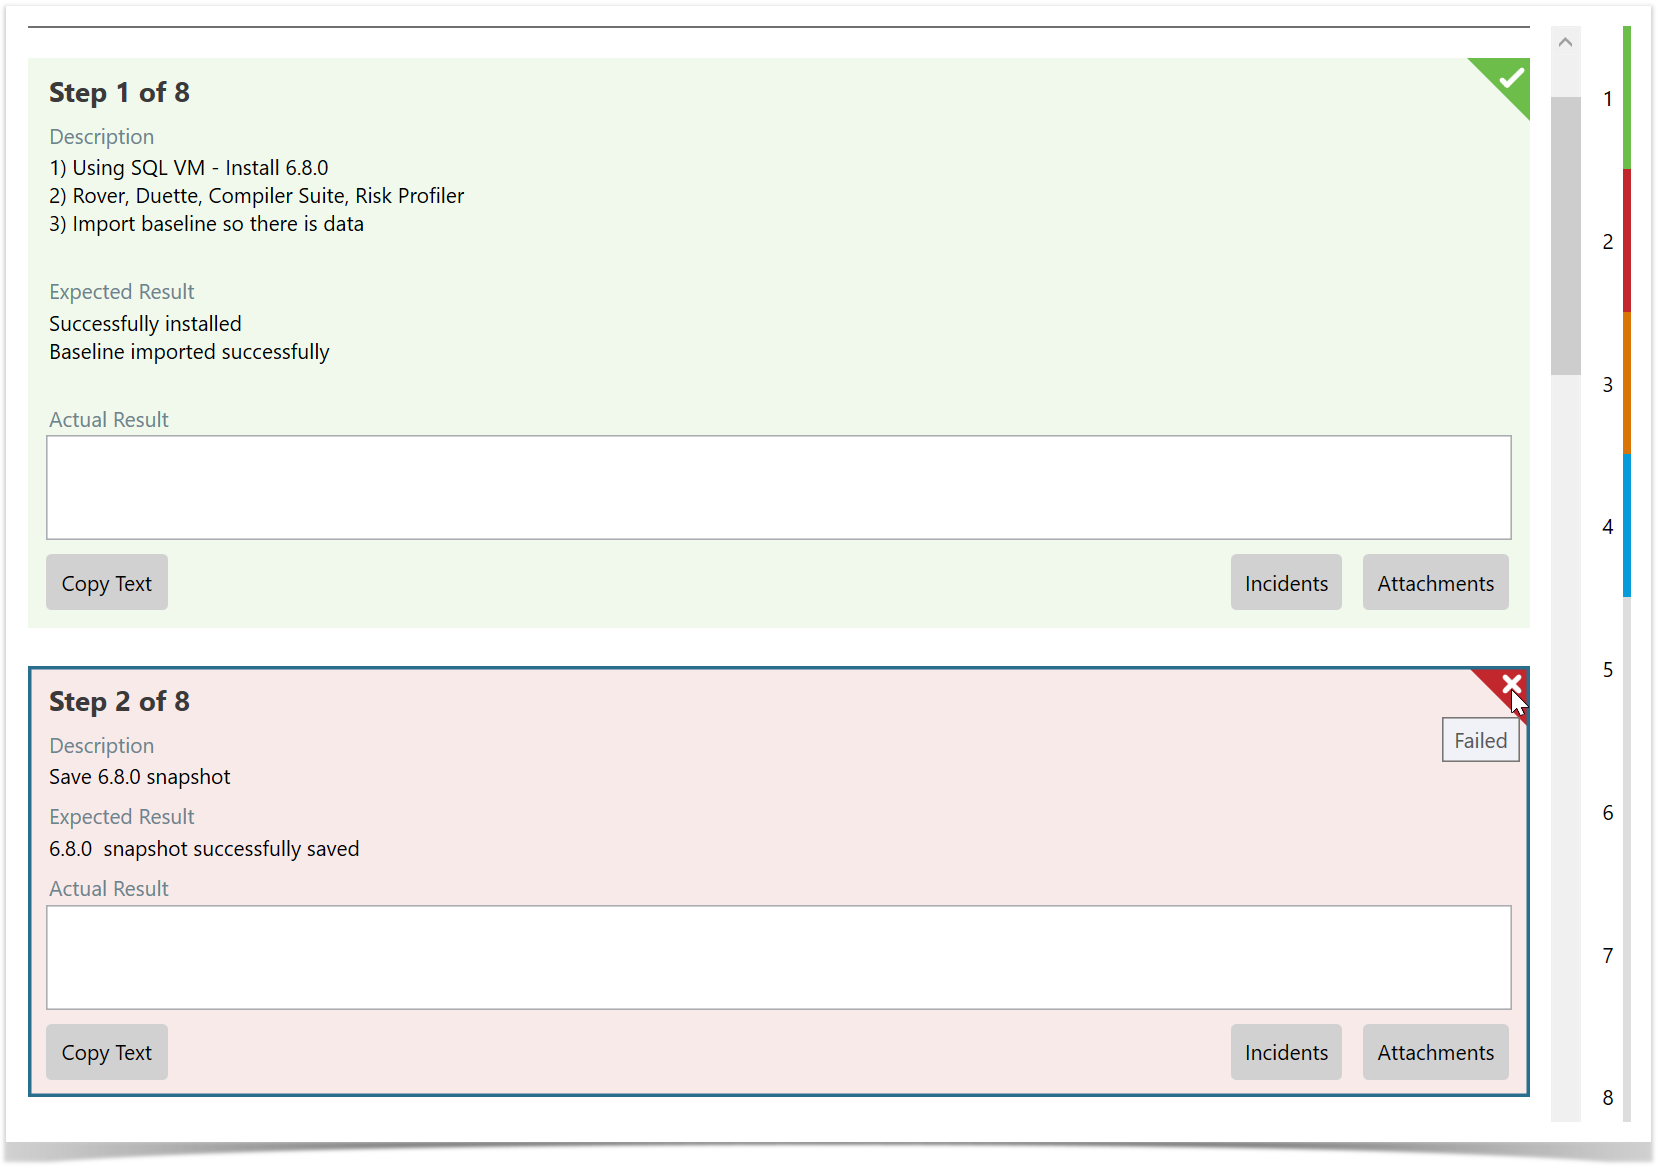
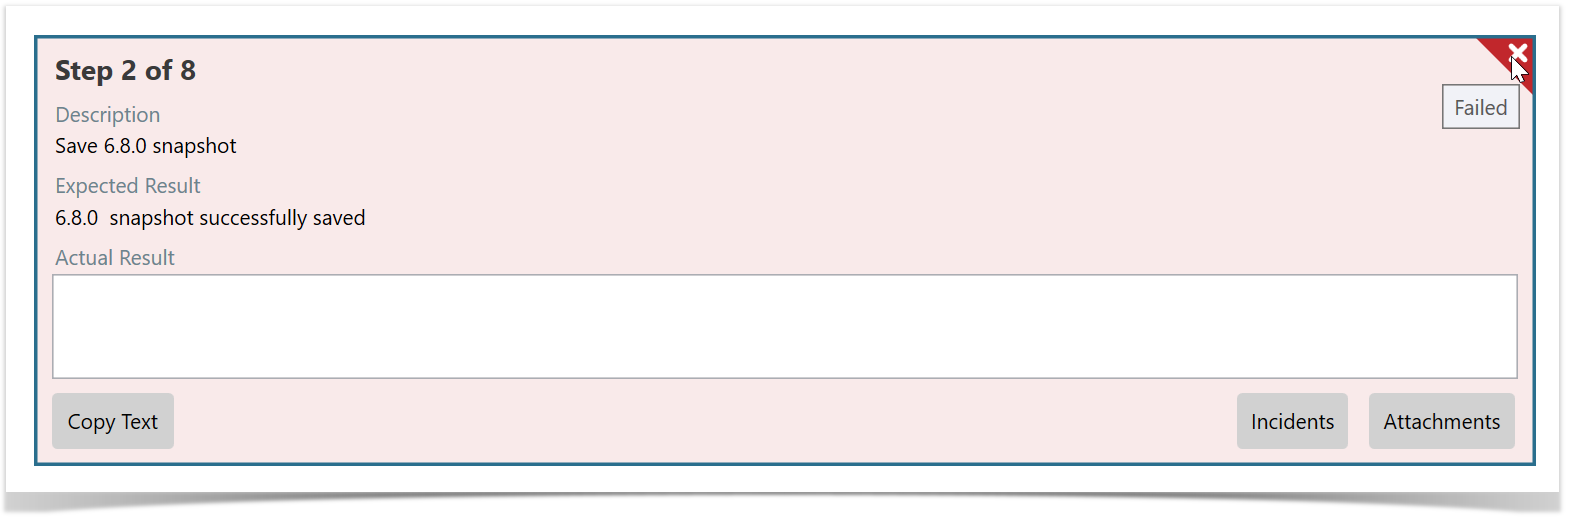
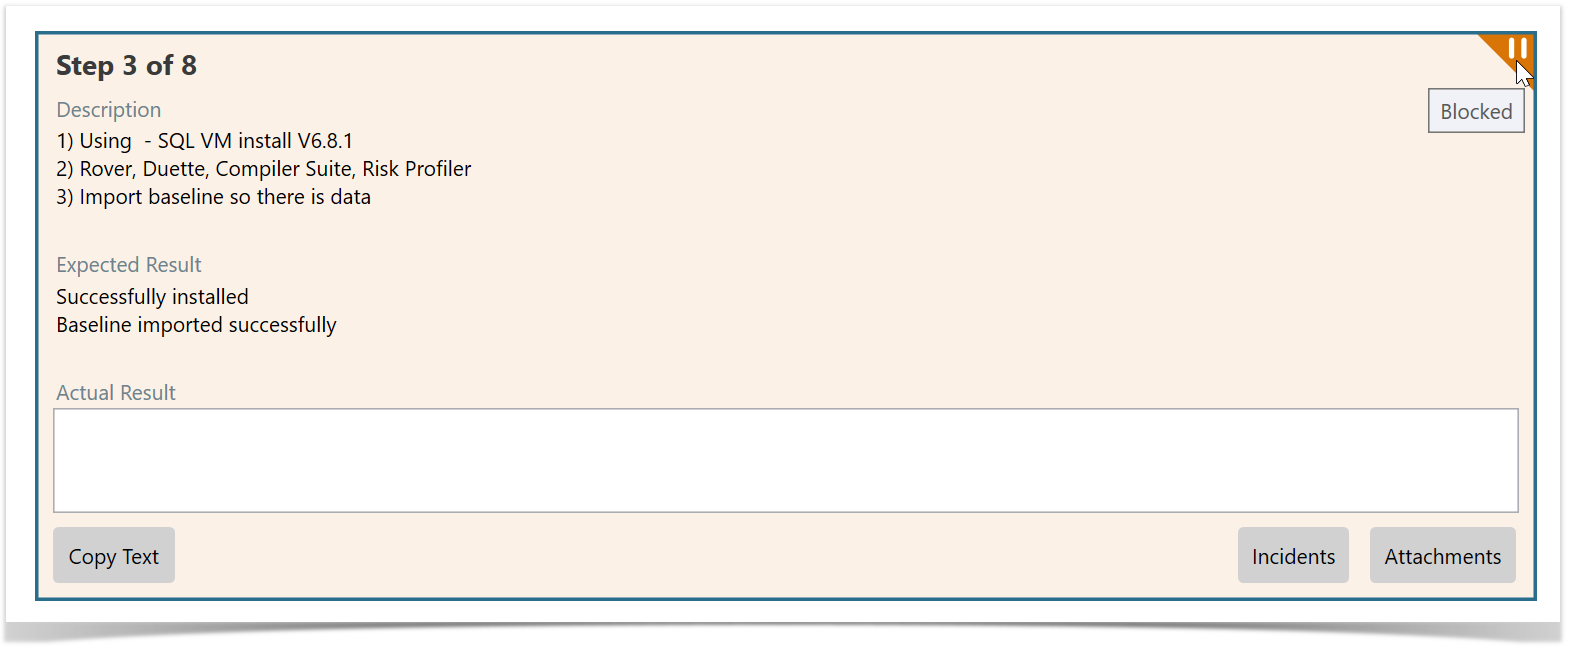
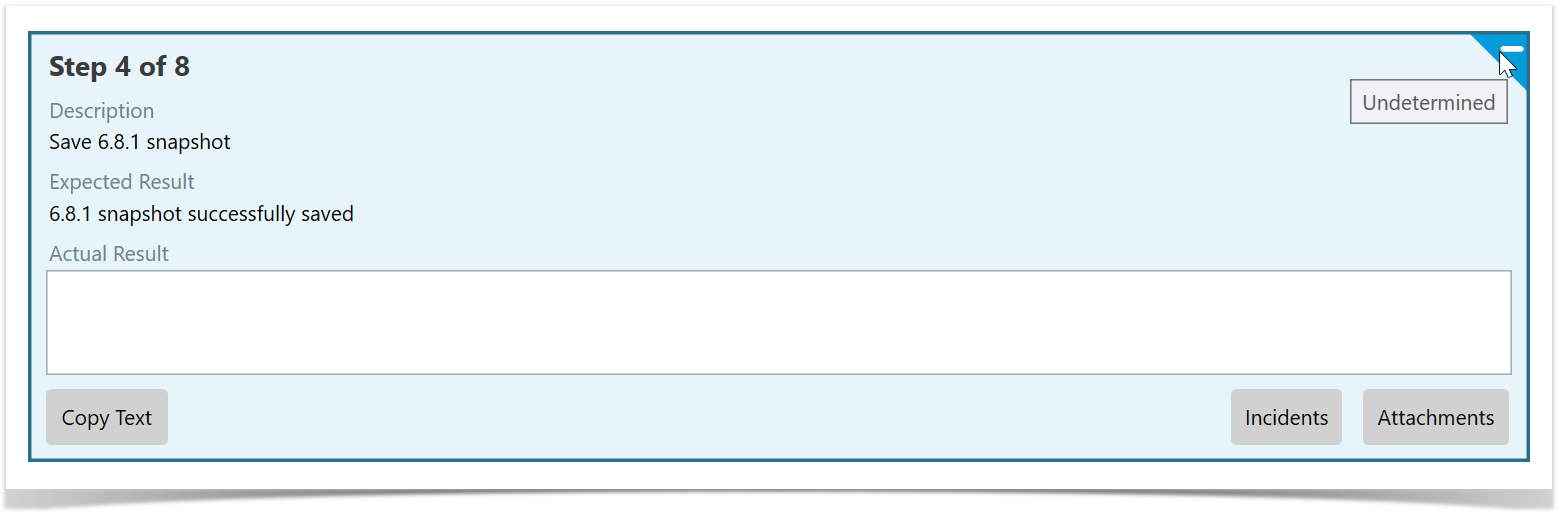
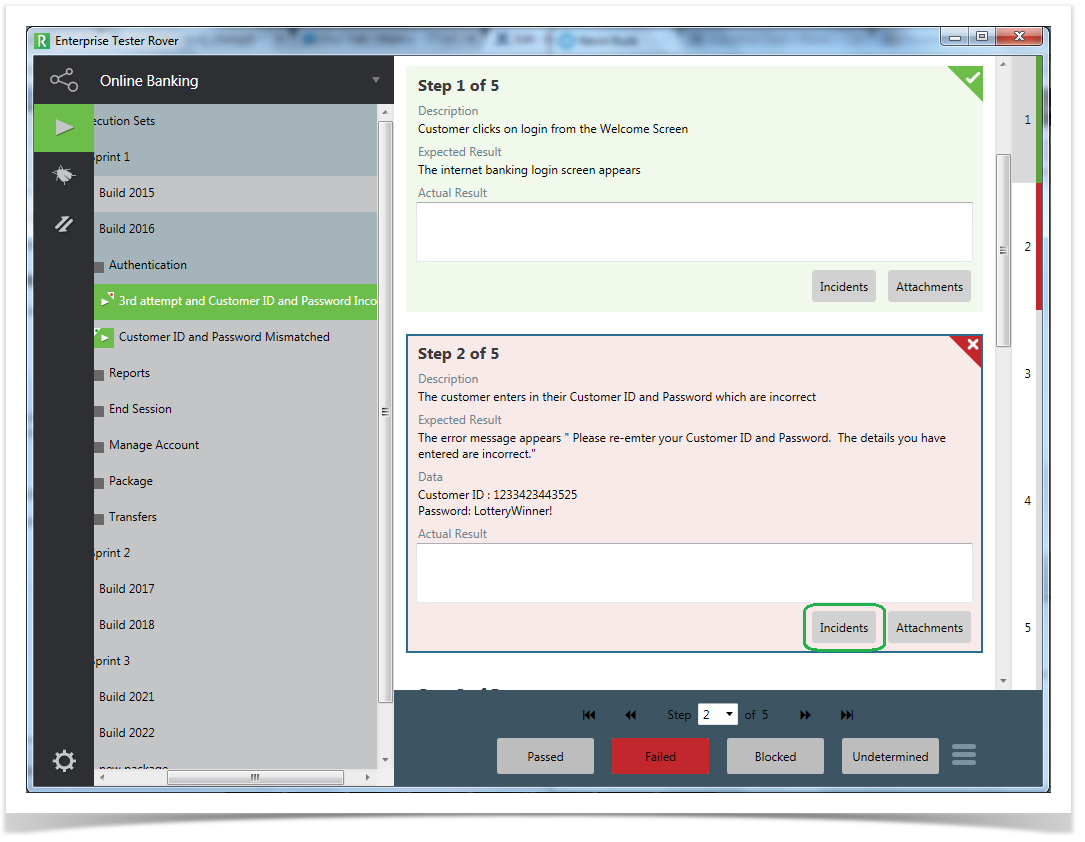
Hyperlinks and local paths can be added in the Actual Result field. Depending on the status for the step you'll notice that a status icon will be added to the step and the step background will be shaded. You'll also notice that the bottom status menu highlights the status of the current step. In the image below, Step 2 is highlighted and the status is Failed. You'll also notice that the status bar is color coded according to the status of each step. This makes it easy to see the status of each step at a glance.
Passed
Failed
Undetermined
Failing a Step and logging an IncidentTo log an incident on a Failed step, click or tap on the Incidents button under the Actual Results field on the step to open the Create Link screen. The Create Link screen will display:
You can either edit the Summary field (Bug Name) or leave it as the default name.
Once you have selected Save the window will close and you will be returned to your run. Limitations Rover does not currently support the following Enterprise Tester features:
|

The Incident can be viewed and updated by clicking on the incident in the list.
Managing Incidents
When running a test you can log an incident straight from the failed step ( see the Execution Sets article for more information of running test) by clicking on the Incidents button.
The incidents screen will display any incidents that are already linked to the script assignment on the same step and an area from creating a new incident or linking to an incident that was downloaded from the ET server or was previously created. You can also create a new incident that will automatically be linked to the step.
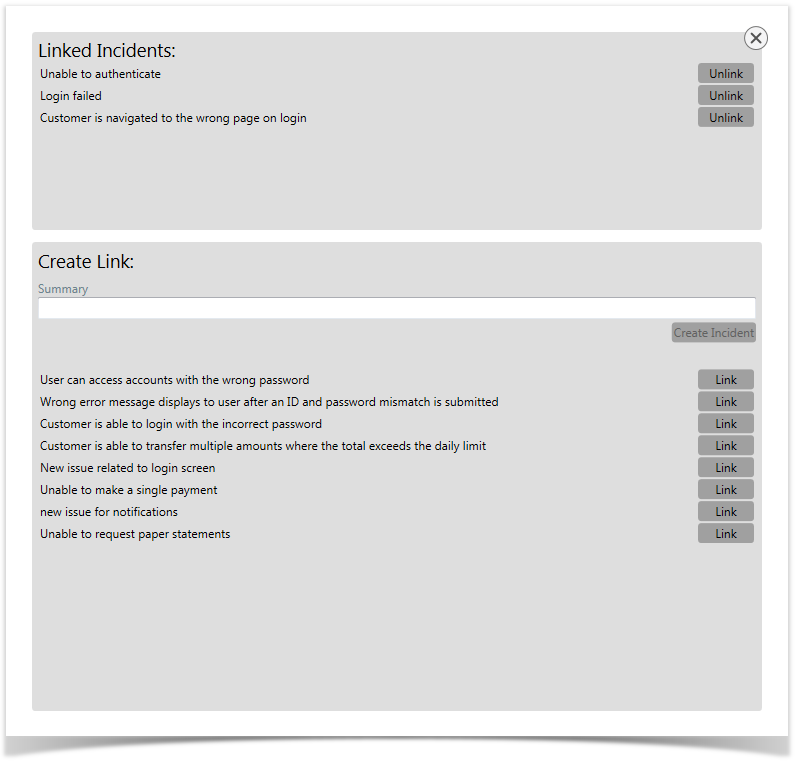
Linking Incidents to the Script Step
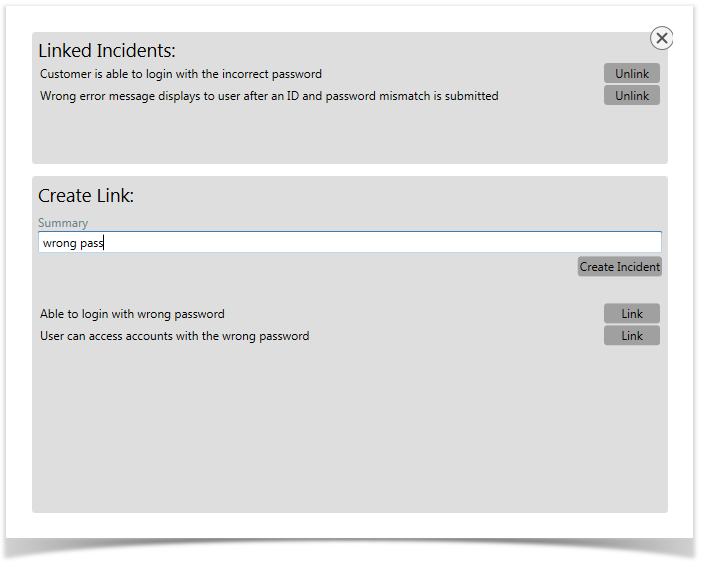
From the Step Incident screen, you can view all linked incidents, link additional incidents or create a new incident.
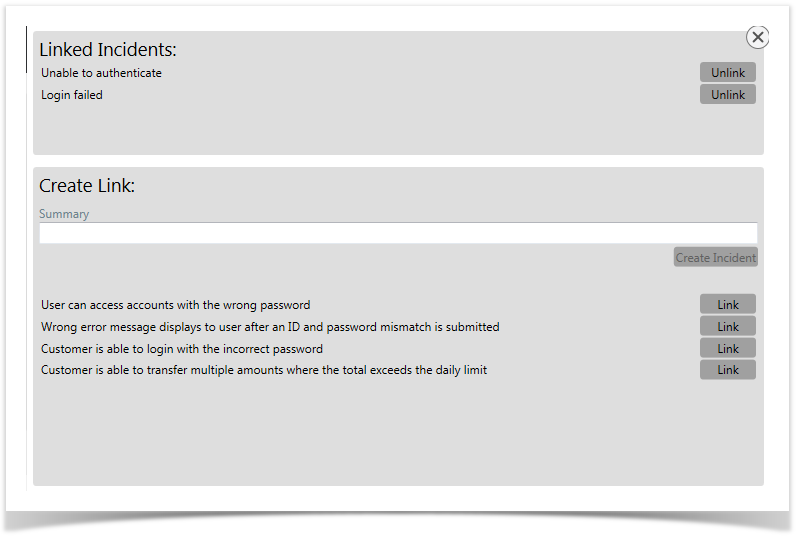
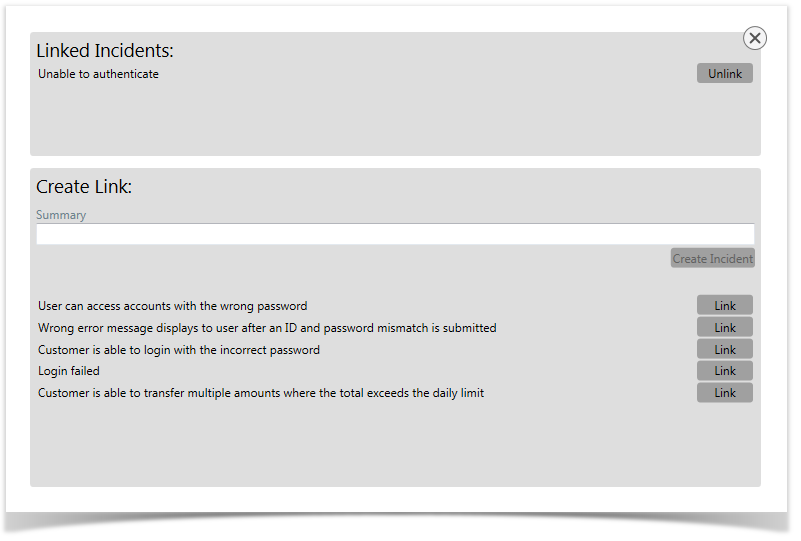
Incidents linked to the step can be added by clicking or tapping on the Link button associated with an existing incident. All incidents that are already associated with the step are listed in the Linked Incidents section. These can be disassociated from the step by clicking or tapping on the Unlink button.
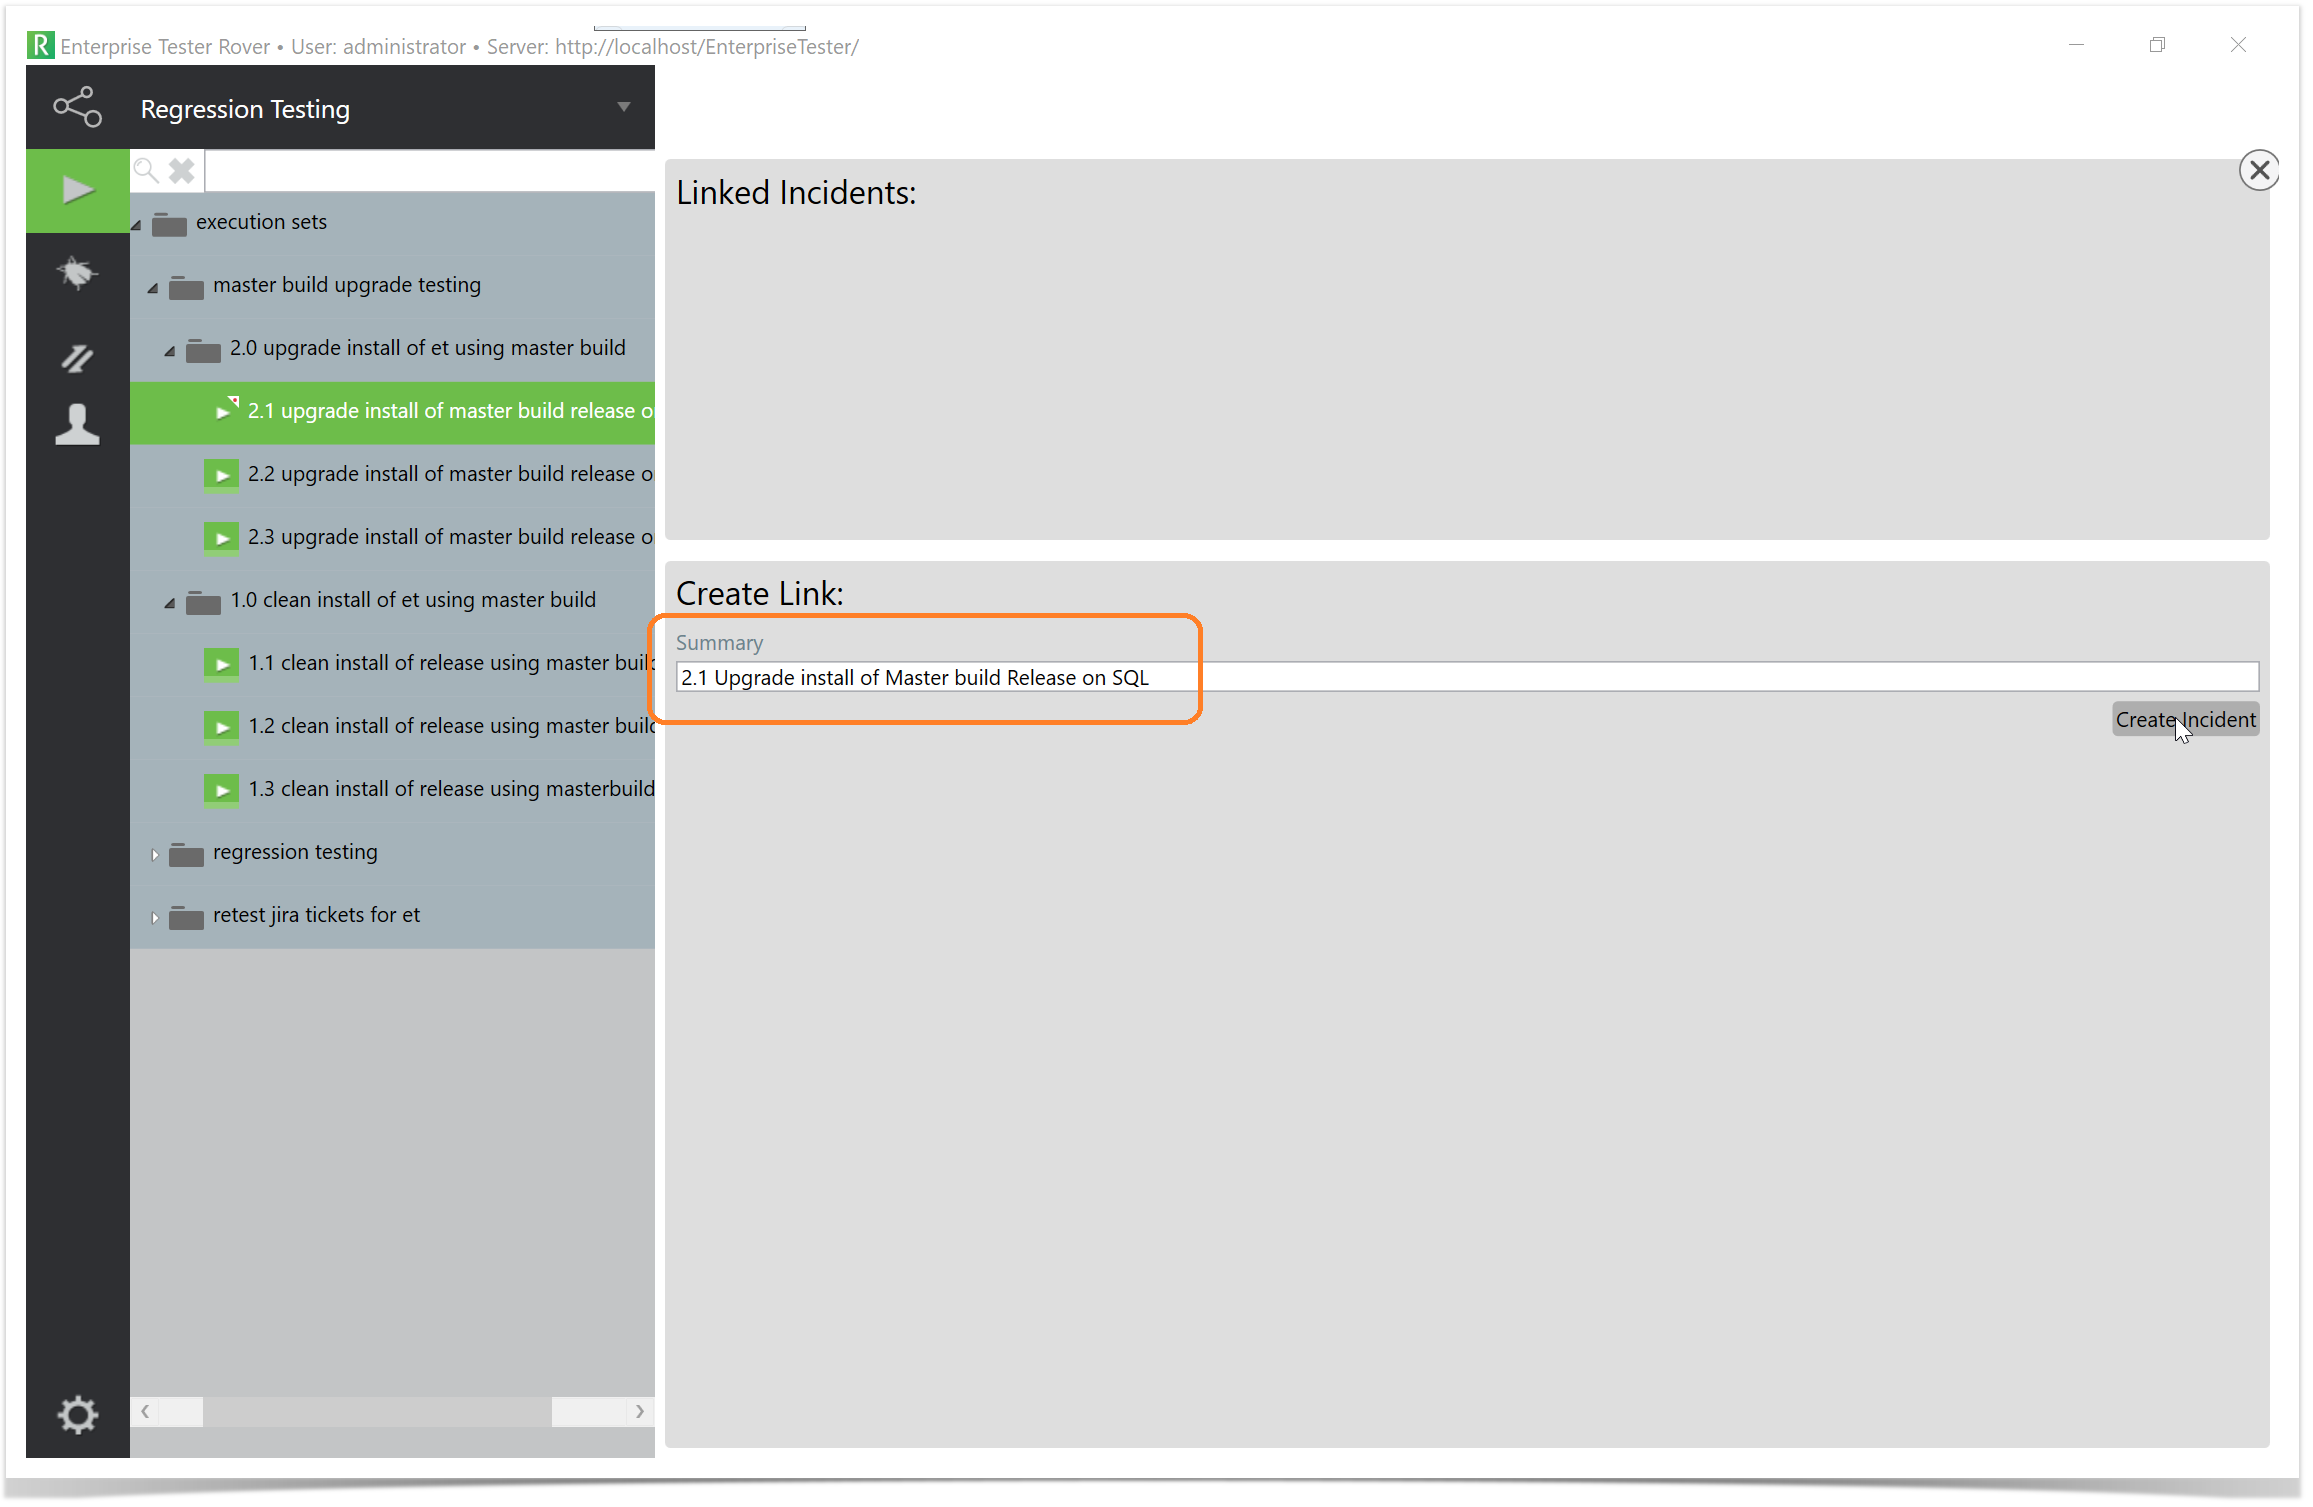
You can filter the existing incidents by starting to type in the Summary field. This will automatically filter all incidents that match the text you have entered
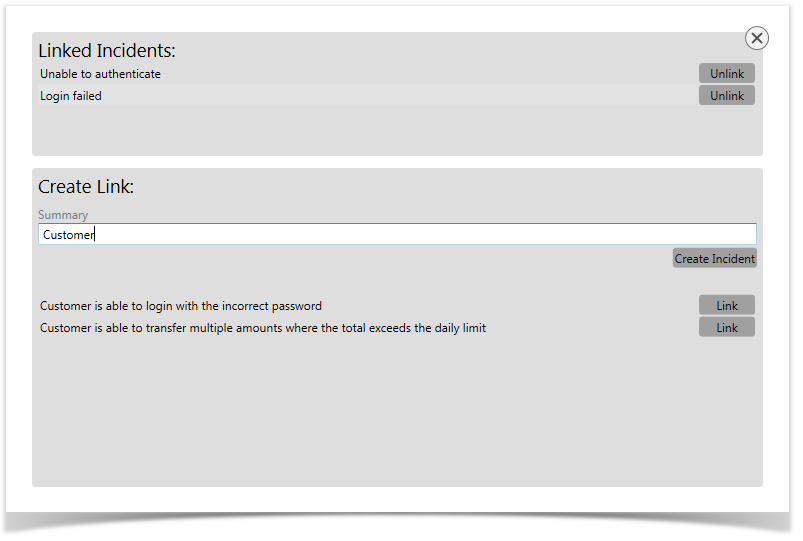
Creating an Incident
Incidents are easily created by adding a summary in the text field under Create Link and then clicking or tapping on Create Incident.
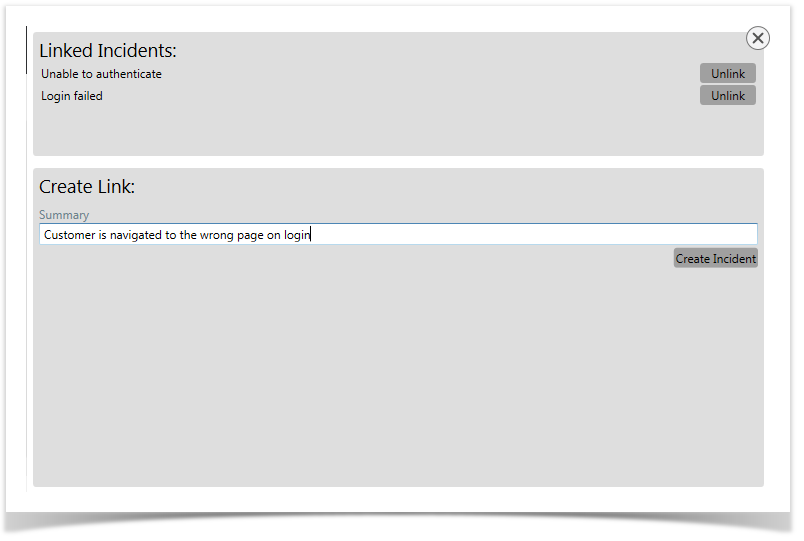
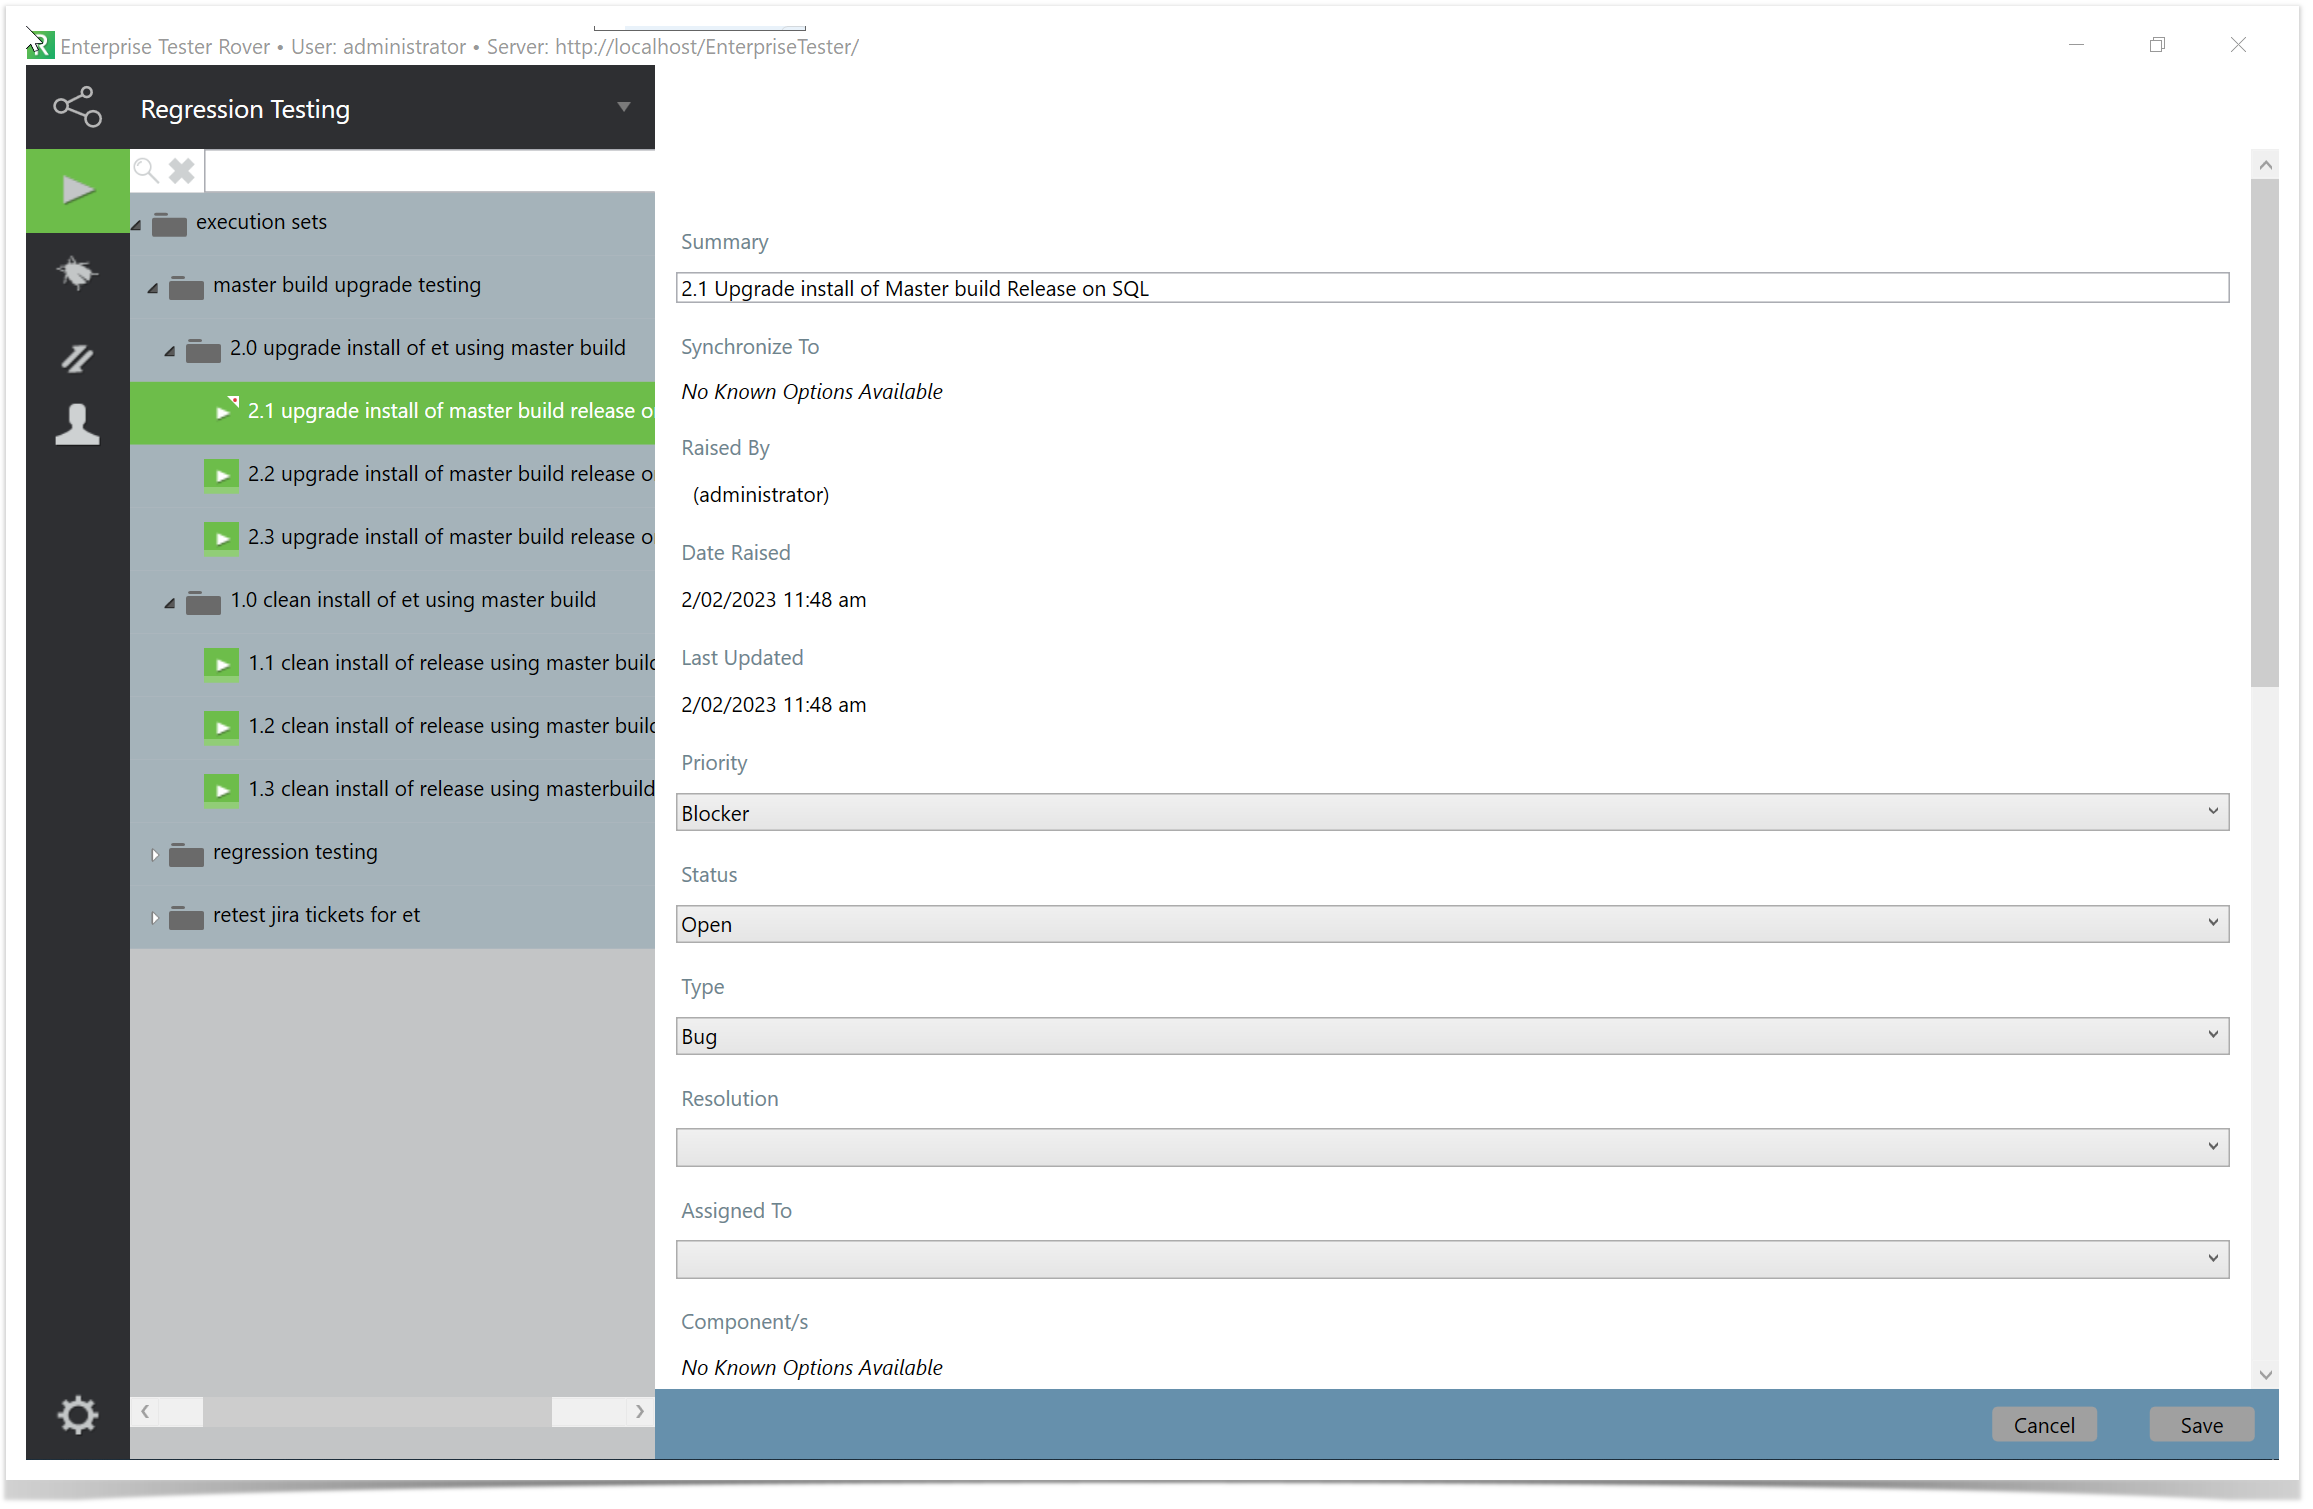
The Incident Create screen will appear where you can all of your details including all the fields that have been configured in ET, attachments and comments. You can also select the External System Link ( Defect Tracker Project Link e.g. JIRA or TFS projects) that have been pre-configured in ET for your project. If you select a external link, the incident will be synchronized with your external system ( JIRA or TFS) when the incident is uploaded to the ET Server.
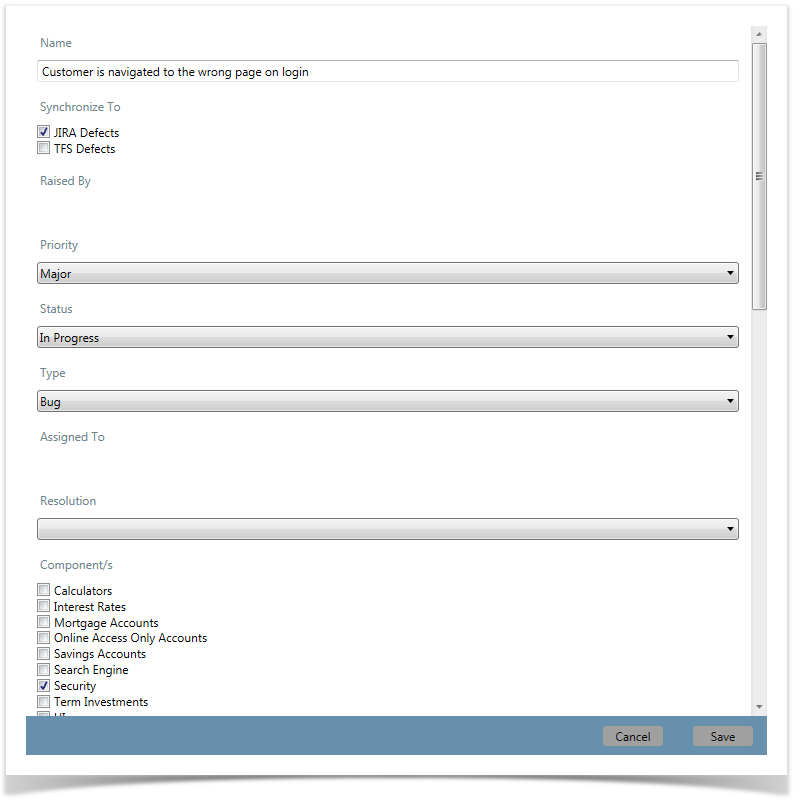
When you have finished entering your details, click or tap on Save. You will be returned to the Step Incident screen and your newly created incident will appear in the Linked Incidents section.
You can now either close the screen to return to your run or log another incident.
Once you have completed your testing, you can synchronize your runs and incident back to the ET Server. The Synchronization article provides details on how to complete this task.
...