...
The following over time gadgets are available in Enterprise Tester:
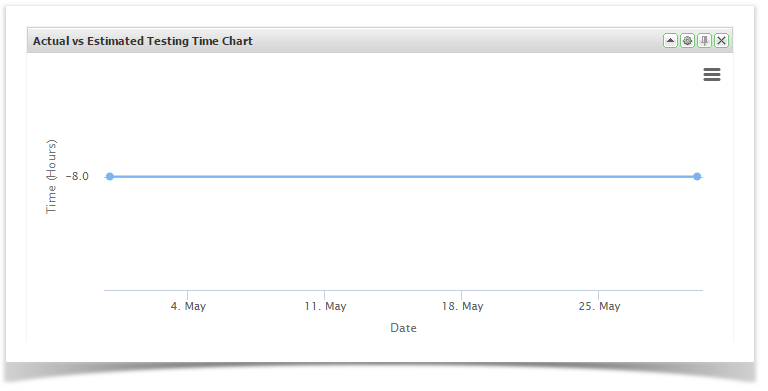
- Actual vs Estimated Time
- Burndown Chart
- Incident Numbers
- Incident Rate
- Tests Completed
...
- Drag and drop Actual vs Estimated Time from the available gadgets onto your workspace
- Click on the Configuration button and enter the required configuration
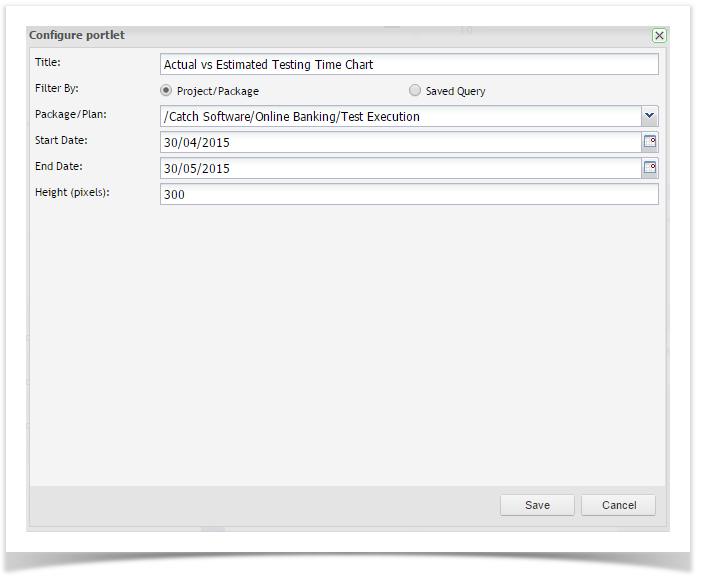
- Click Save
Burndown Chart
These allow you to view summary data from any of the saved queries you have created. You can create gadgets for either a specific execution set package/folder or for a specific set of data by using a saved query.
See Searching & TQL for information on how to create these queries.
- Drag and drop the Burndown Chart from the available gadgets onto your dashboard Click on the Configuration button
- Enter in a title for the chart. This will be displayed on the title bar of the gadget on your dashboard
- You can select the data you wish to chart by selecting either an execution set package or a saved query
- Enter in the start and end dates. By default these fields will default to today's date and the date one month later, respectively
- Enter in the velocity (tests/day)
- You can select to change the height of the gadget. The height for all gadgets defaults to 300 pixels
- Once you have completed the fields, click on Save and the gadget will be displayed
Incident Numbers Over Time
...