All dashboards are made up of gadgets that can be dragged onto the dashboard and then moved around as required.
The following coverage reports are available in Enterprise Tester:
- Matrix Report
- Coverage using a Bar Graph gadget
- Coverage using the Has Coverage or Provides Coverage queries.
Coverage using a Bar Graph gadget
- Create and save a query containing all the Requirements you would like to view Coverage for.
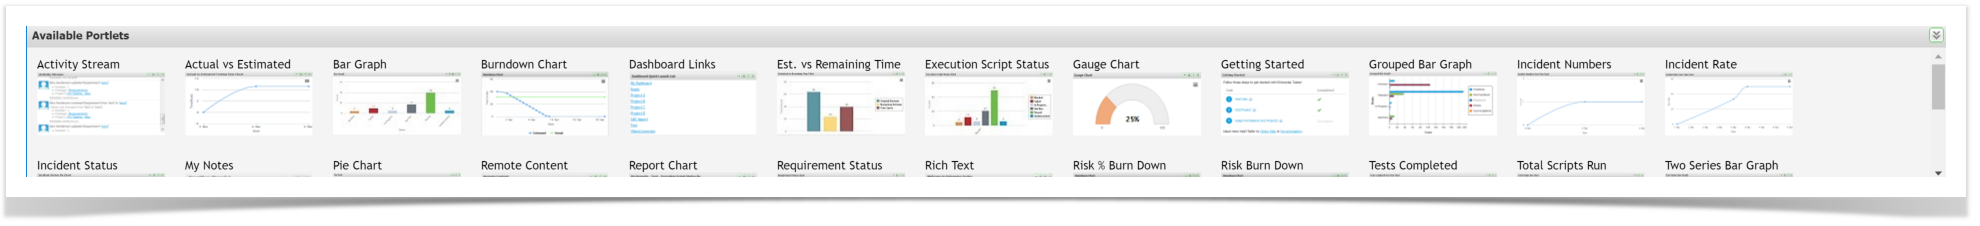
- Drag and drop the Bar Graph gadget onto your dashboard from the list of available gadgets.
- Click the
 button to configure the portlet.
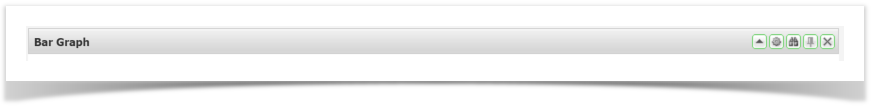
- Select the Query you previously saved, set the Field value to Coverage, set the Function to Count.
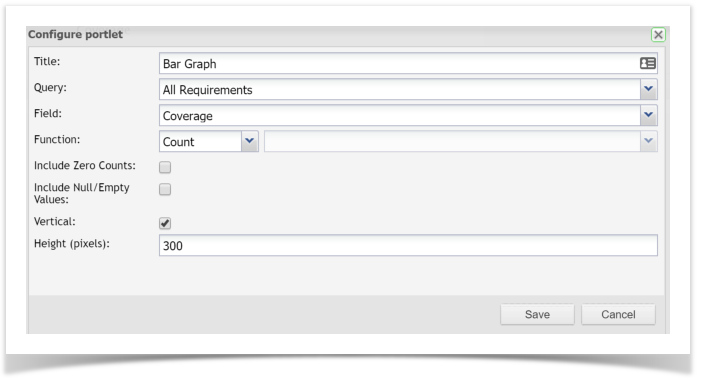
- Click Save for the graph to display.
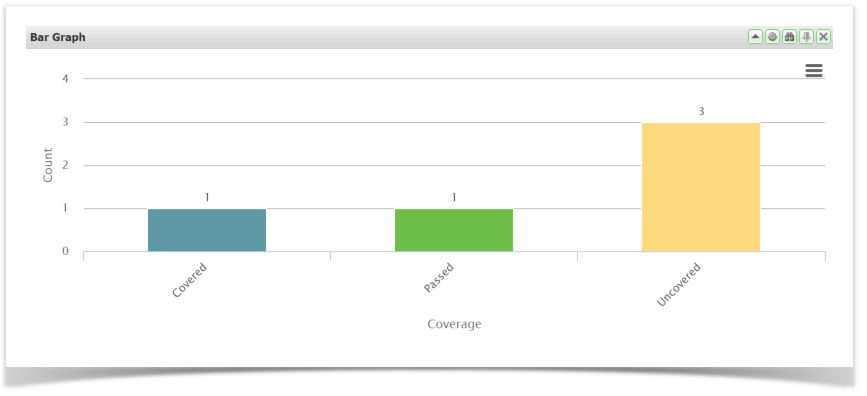
How coverage values are calculated in this report:
Requirement exists only = Uncovered
Requirement has a relationship to a Test Script or Automated Test = Covered
Requirement has a relationship to a Test Script or Automated Test, and a relationship to a Test Script Assignment (Run) or Automated Test Assignment (Run) = The actual status of the Test Run e.g passed or failed.
Note
This is an example of how Coverage can be used.
Coverage is also available in other charts such as Pie, Grouped Bar Graph, Two Series Bar graph etc
Coverage using a simple query
To find all requirements in a project that have coverage, create a query:
Project= "Project Name" AND HasCoverage = True
To find all Scripts or Automated Tests in a project that provide coverage, create a query:
Project= "Project Name" AND ProvidesCoverage = True