This report shows the progress of the test comparing the Estimated to the Actual time spend so far.
The Results Tab
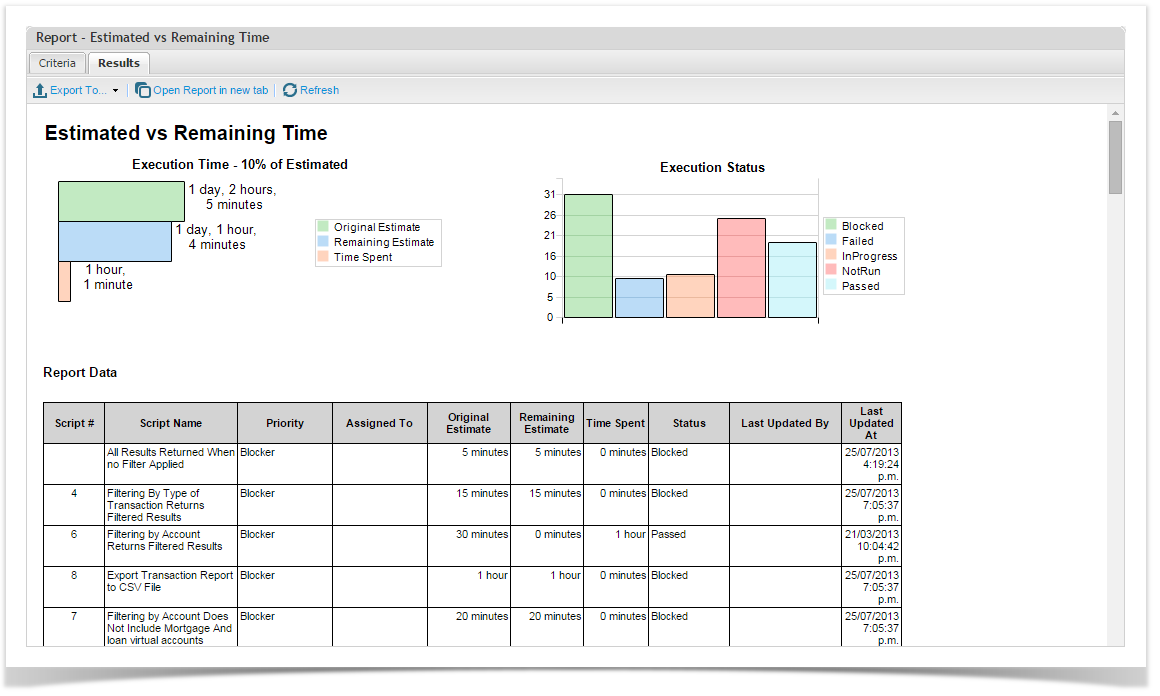
This report has two graphs:
Execution Time
This shows the total estimated for the selected execution scripts verses the actual and the remaining time available. Note that once all the estimated time has been used no remaining time will be displayed as shown above.
Execution Status
This shows the number of scripts that are in each status
The report data is then shown in the table below.
The Criteria Tab
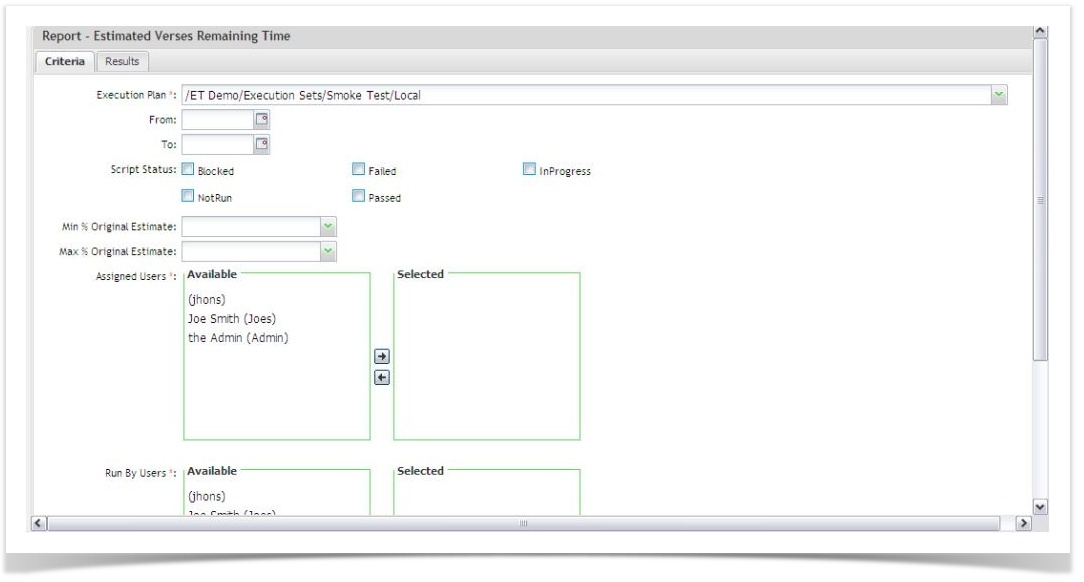
The available filters for this report are:
Execution Plan | Filter to select a plan within the test execution set for the project |
From | Filter to tests run after a date |
To | Filter to tests run before a date |
Script Status | Select the required values |
Min Original Estimate | Displays tests where estimated vs. actual % is greater than this value |
Max Original Estimate | Displays tests where estimated vs. actual % is less than this value |
Assigned to | Filter the selected users |
Run By Users | Filter to the selected users |