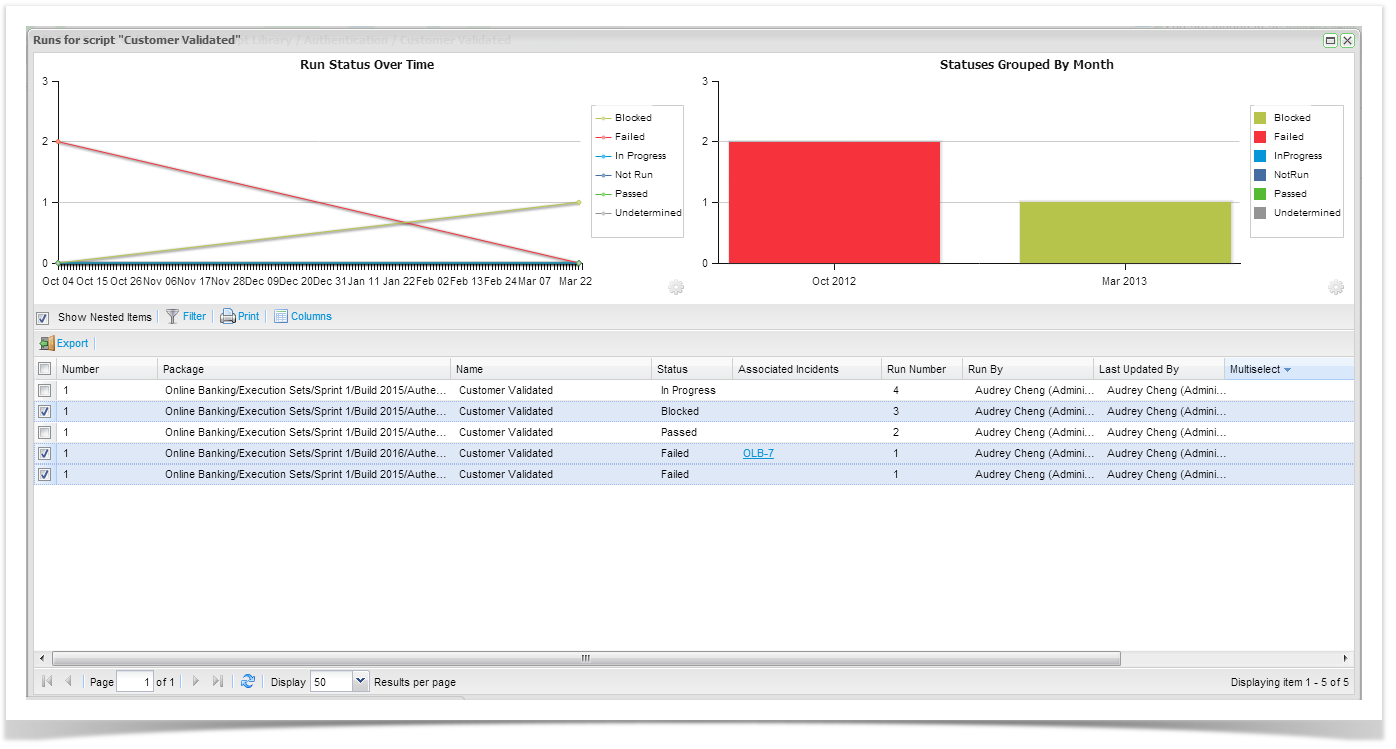
You can view the full run history of the script, by clicking on the Run History tab. This will provide you with the run history across the entire project.
The run history screen provides all historical run details on the summary grid and two charting widgets are also shown to provide summary views of your data across the project.
Here you can select to view a previous run, delete a run, change select different runs on the grid to change the display of the widgets.
Charting Widgets
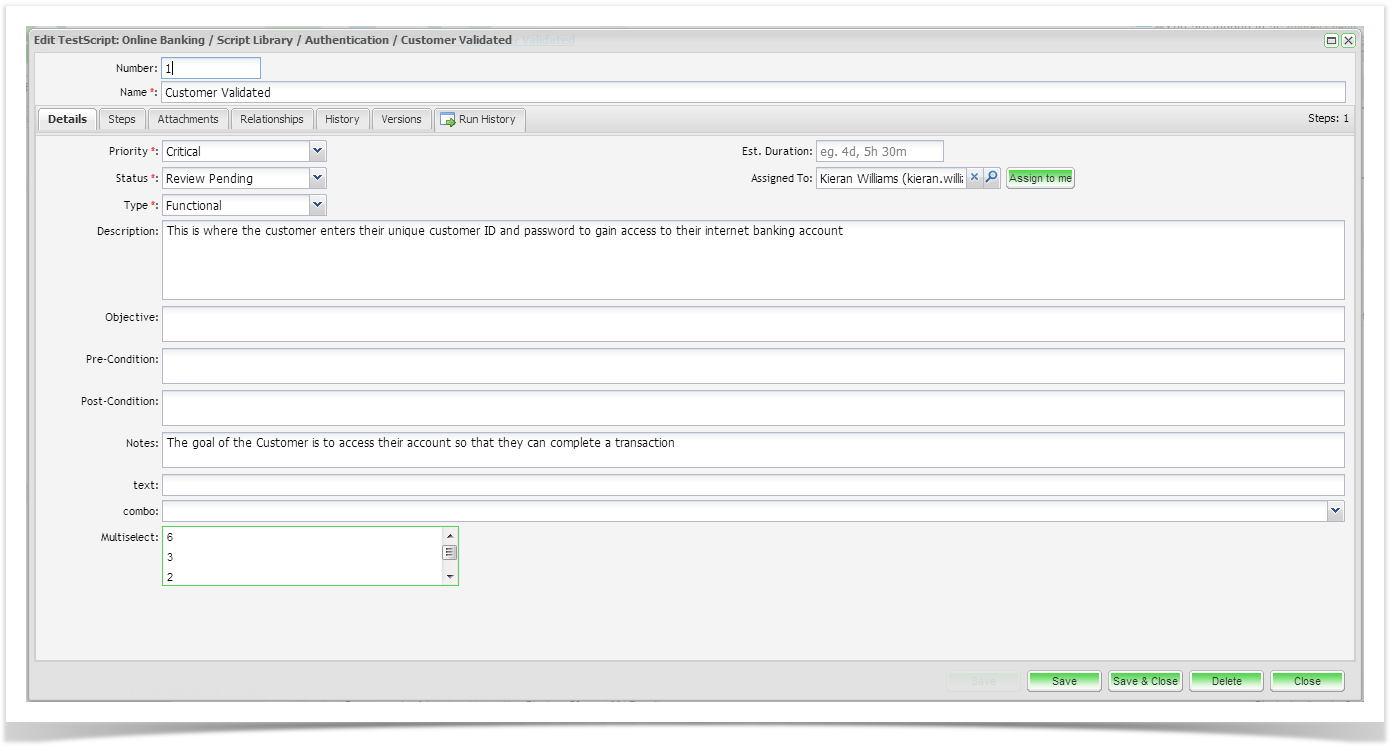
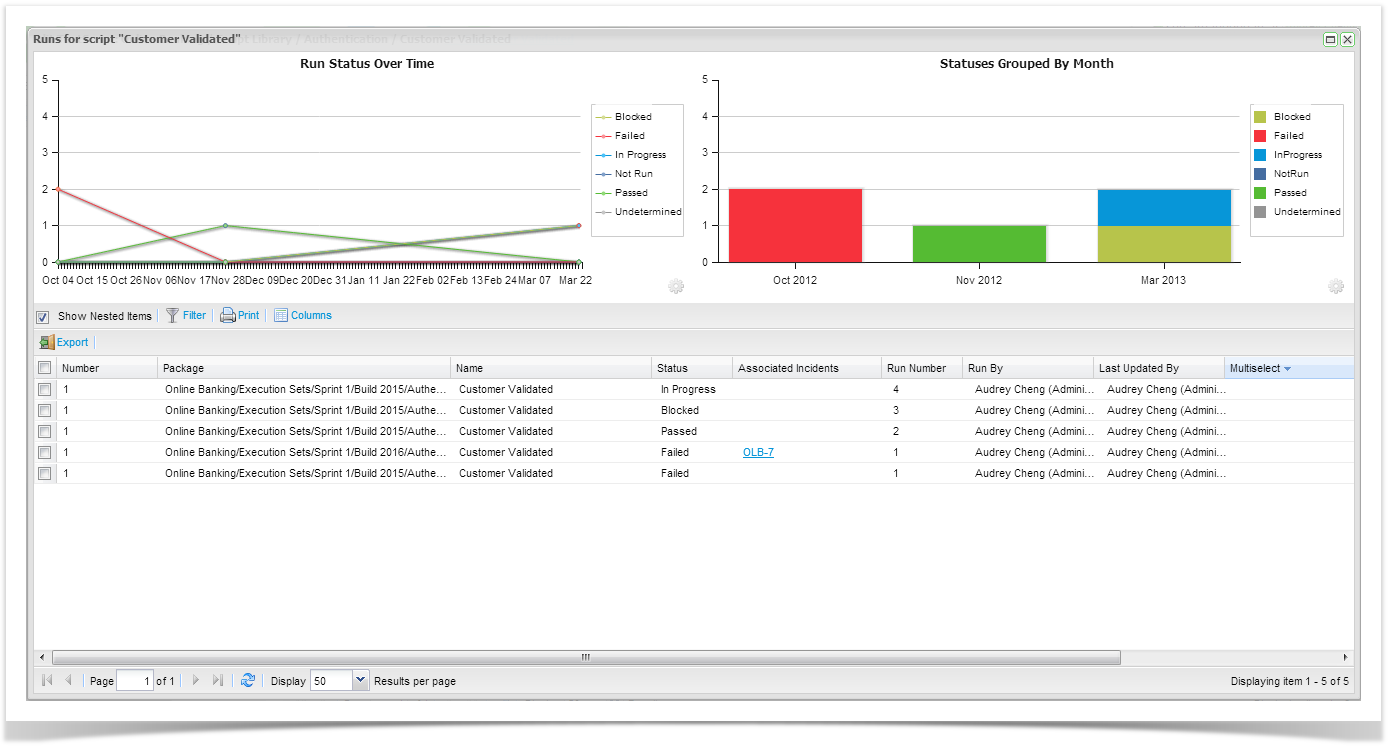
Two charting widgets are provided as standard, the Status Over Time widget and the Statuses Group By Widget. The type of widgets to display are not configurable. From the Run History screen for script assignment. The Status Grouped By widget is configurable and you change chose a date or field parameter to group.
The underlying data for the widgets is driven by the grid. You can click on selected runs to change the data represented on the charting widgets.
Configurable options are available for the Status Over Time widget when viewing the run history for the entire Execution Set folder.
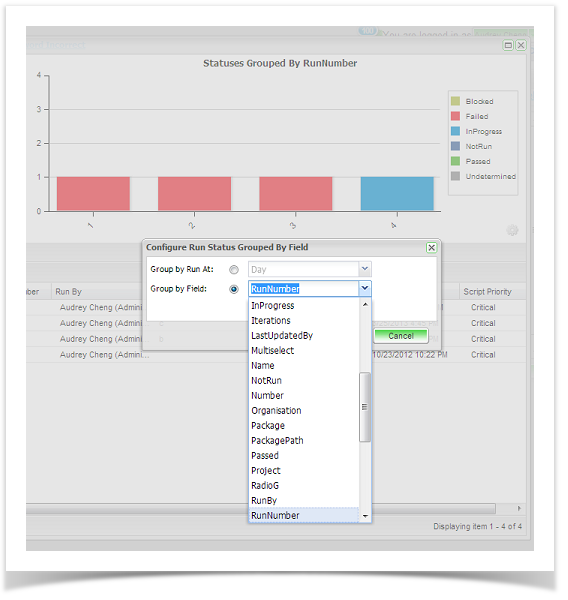
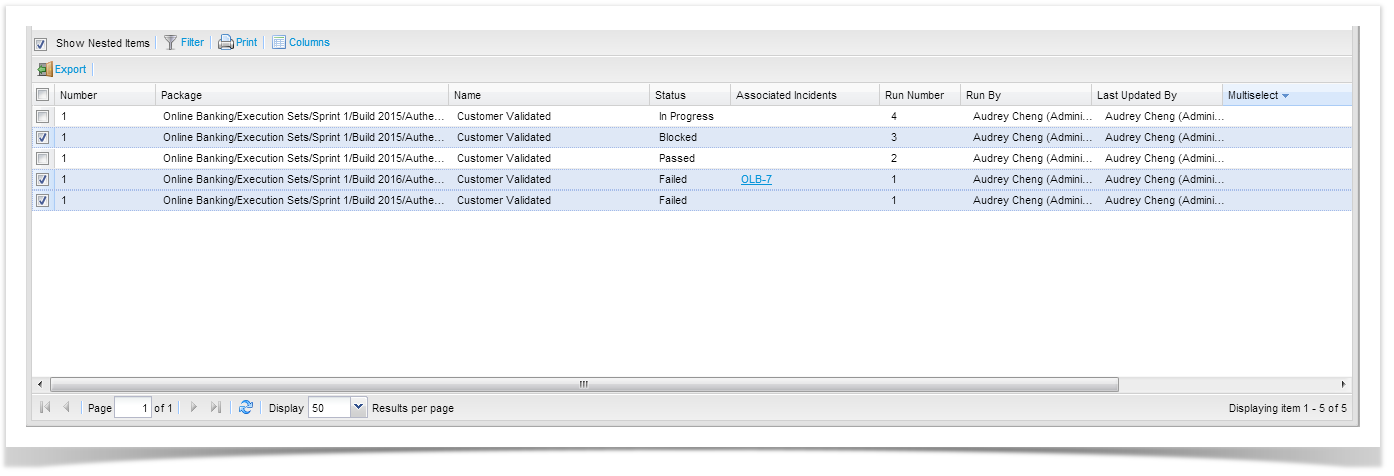
Run History Grid
The details displayed on the Run History grid are configurable. You can click Columns button on the toolbar to select the inbuilt fields or the custom field to display in the grid. You can filter the runs in view by using Search or TQL. Click on the Filter button on the toolbar to access the Search functions.
To view the previous run double click on the run in the grid to open the historical run.
Selecting a few runs will change the data that is charted on the widgets.