All dashboards are made up of Portlets that can be dragged onto the dashboard and then moved around as required. The following chart portlets are available in Enterprise Tester.
Pie Chart
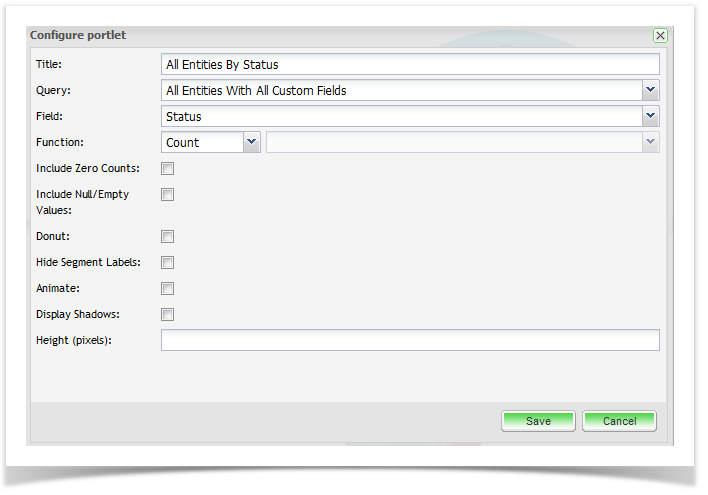
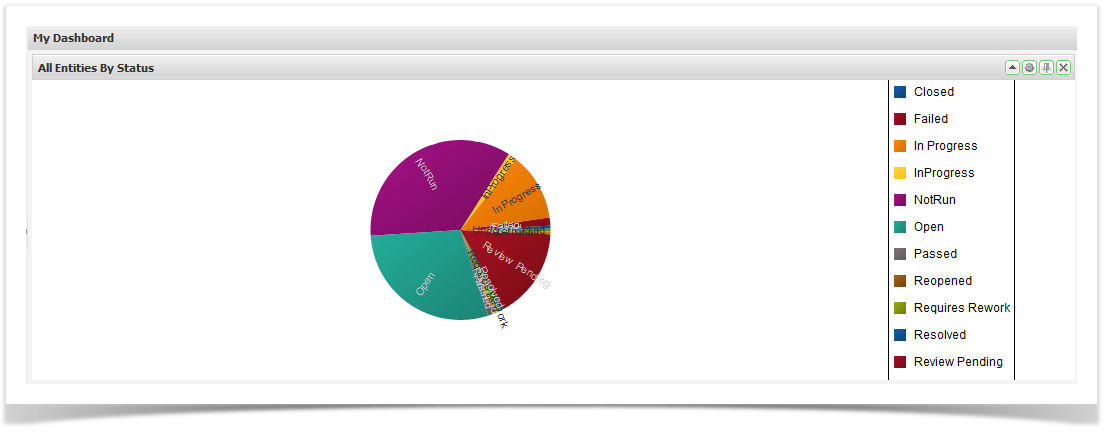
These allow you to view summary data from any of the saved queries you have created. See Searching & TQL for information on how to create these queries.
- Drag and drop the Pie Chart from the available portlets onto your workspace.
- Click on the Configuration button and enter the required configuration.
- Click on ‘Save’.
Report Chart
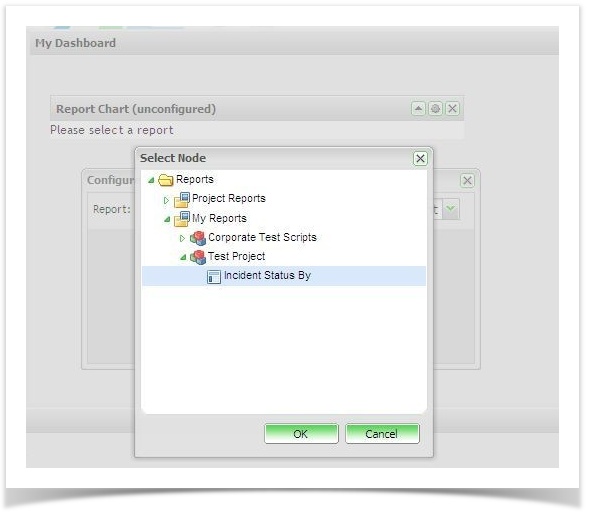
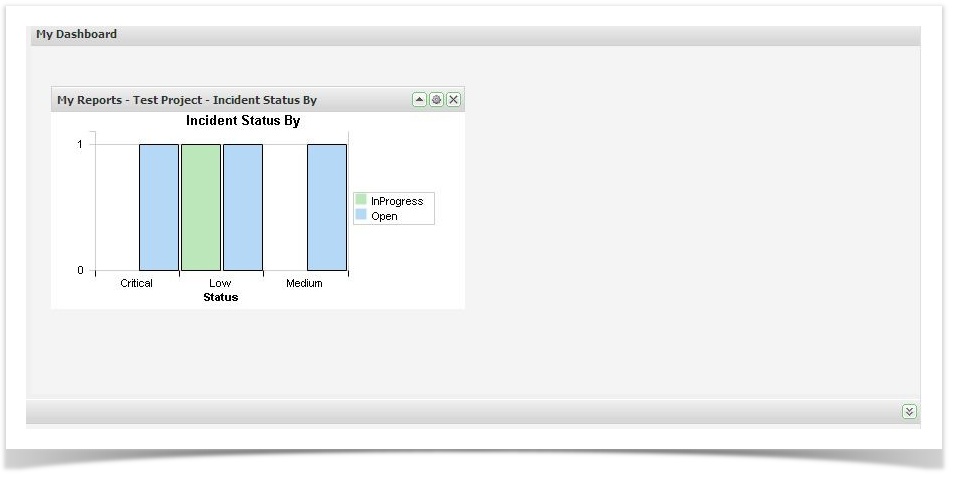
These allow you to view summary data from any of the classic reports that have been created for the projects. To use this portlet you will have had to create reports via the Report Tab in the explorer.
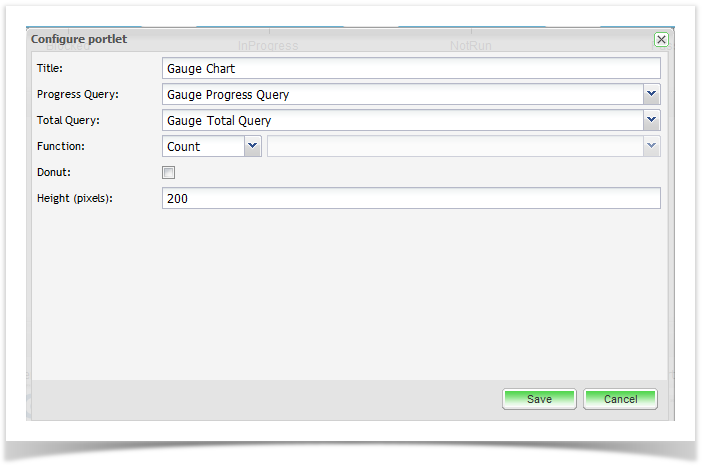
Gauge Chart
These allow you to view summary data from any of the saved queries you have created. This chart is particularly useful when you want to see an indication of the ratio e.g. Progress vs. Total. See Searching & TQL for information on how to create these queries.
