Overview
Enterprise Tester includes a tool allowing you to run a quick test (normally around 10 minutes in duration) that will run your Enterprise Tester through a number of stress tests.
As part of this process we calculate the performance of your server in various categories:
- Data Creation (the time it takes to create and update data including baseline creation and restoration).
- Indexing (the time it takes to perform re-indexing and update the search index after changing data).
- Searching (the time it takes to perform common searches, including fetching all the column information back from the database).
- Data Deletion (the time taken to delete entities of various types - deletion performance affects both deleting of entities and restoring of baselines).
The total time taken to complete each of these tasks will result in a calculated score, and then the overall score of your Enterprise Tester server is based on the lowest value.
A score of 5.0 is considered an average Enterprise Tester server, with a score above 5 being an above average system.
Running the Test
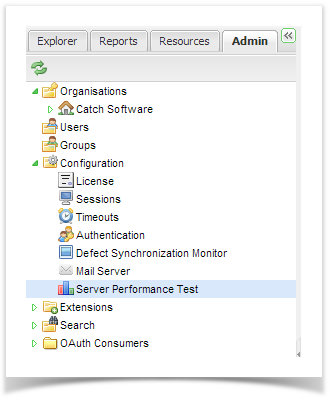
You can access the Server Performance Test under the Configuration folder of the Admin Tab.
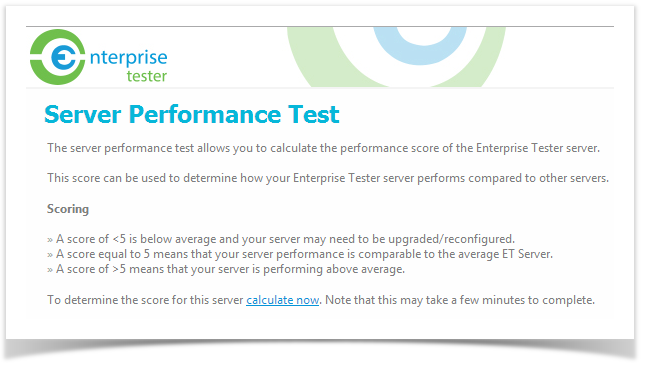
If this is the first time you have accessed the screen since starting the ET server, then you will see this message:
Test results are persisted while the ET server is running, but if you restart the ET server, then returning the Server Performance Test page will prompt you to run the test again.
This is done intentionally to ensure the score you see is for the hardware/configuration ET is currently running on.
Click "Calculate Now" and the performance test will begin to execute. This can take up 10 minutes, and may put some stress on lower-specified servers, which could impact on other testers using the system.
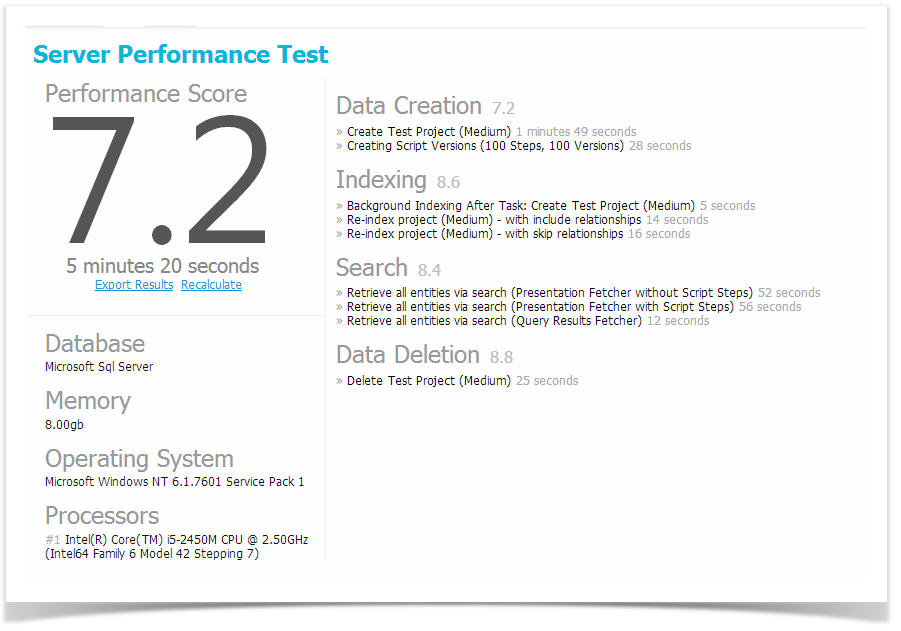
Once the test is complete the results will be displayed.
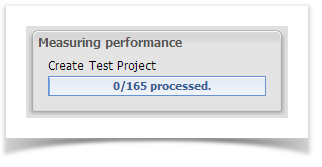
Notice in the above screen show the first task being undertaken is "Create Test Project". The server performance test generates its own test data and you may see a project temporarily appear on your Enterprise Tester instance. This project is used to perform the steps of the test and is eventually removed at the end of the test. If you are concerned this may alarm your users, we recommend running the test outside of business hours to ensure no disruption or confusion is caused.
Viewing Results
When the test has completed the result view will be displayed.
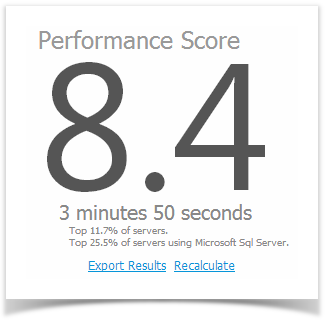
From here you can see the overall score, how long the test took to execute, along with details of each of the sub-scores.
If your Enterprise Tester server has internet access it will also be able to determine your ranking against other Enterprise Tester servers - in this case the ranking information will be displayed underneath the total score:
This allows you to see how your server compares against other Enterprise Tester instances around the world, including just for Enterprise Tester instances running on your target database.
Interpreting Score Rankings
A rough guide to server performance scores is:
- A score of 5 is average and comparable to how other ET servers are performing on average.
- If your score is above 5, you're in good shape! Your ET server is performing above average.
- If your score is less than 5, then your server could be optimized.
Understanding Below-average scores
If your server has below-average scores or rankings, this is not necessarily any reason for alarm - if you find the performance of your Enterprise Tester server is good when in use, then low scores may be caused by:
Other people using the Enterprise Tester server while the test is running.
A background task being run on the server (such as backups, a virus scan or other periodic task)
One area skewing the results - for example if your database server is virtualized you may find tasks such as data-creation score lower then average, but in practice this will have little impact on the day-to-day performance of the Enterprise Tester server.
You are using ET with a small number of users (our rankings are license-level agnostic, so where as a large-scale deployment of Enterprise Tester may be on high-performance hardware and score a 7.0, a 5 user instance of ET may be on a smaller server and only score a 4.5, but the end-user experience of both environments is similar due to the reduced load on the 5 user server).
If your scores are very low, and you are experiencing poor performance within the Enterprise Tester application we suggest you log a support request and attach and export of your performance score details to your support request for review by our technical support team.
Changing Your Score
Making improvements to your hardware may not necessarily improve your overall score - this is because the performance test takes the lowest sub-system score when calculating the overall score - so for example if you upgraded the CPU and memory in your ET server, this may improve your search and indexing scores, but if these are already higher than the data creation and data deletion scores, it will have no effect on your overall score.
Don't let this worry you though, increasing a sub-score will yield real performance improvements within Enterprise Tester for your users. ET only take the lowest score for purposes of ranking servers against one another, and because it's more indicative of overall performance then take an average or median of the sub-system scores.
Is the Score Similar to a Windows Experience Index Score?
The windows experience index (WEI) is a feature introduced in Windows Vista and above that allowed you to determine the performance of a number of sub-systems within your computer, including CPU, Memory, Disk and Graphics. Like Enterprise Testers server performance score, the WEI uses the lowest score to of all sub-systems to determine the overall score.
However the WEI score measures hardware-level performance. This means that other then small performance improvements due to driver improvements, the score will not change unless the hardware in the machine changes.
In the case of the Enterprise Tester server performance score, this is not the case. When changes to Enterprise Tester including the introduction of new features, changes to existing features and performance tuning to the underlying code occurs, your server's score may go up or down slightly. In addition, some things, such as number of projects or number of users within your ET server could have an impact on the score over time.
Exporting Performance Results
On the results view screen are 2 blue links:
- Export Results
- Recalculate
Clicking "Export Results" will allow you download a .JSON file containing the performance score information in detail. The Catch Support Team may request this file when assisting you with performance-related issues.
Enterprise Tester currently does not persist past server performance test results. If you wish to save past results in order to compare them against future results, we suggest using the export facility, or taking a screen shot of the results view screen (this may be easier to read than the exported results file).
