You can set-up dashboards to show summary information related to your test projects.
Dashboards are presented at three levels:
- My Dashboard
- Organization Dashboard
- Project Dashboards
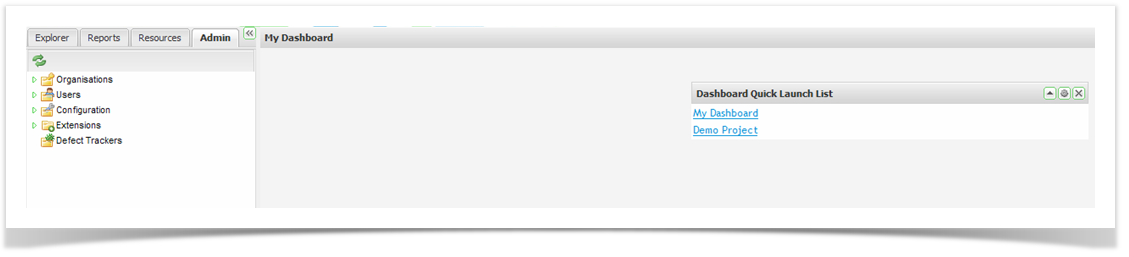
To view ‘My Dashboard’ select ‘My Dashboard’ from the dropdown under the username on the top right hand side. To view the Organization or Project Dashboard right click on the Organization or Project in the explorer tree and select 'View Project' or 'Organization Dashboard'.
Initially you will be presented with a blank screen. To view available portlets click on the arrow in the bottom right hand corner to expand the dashboard portlet window.
Customizing Dashboards
All dashboards are made up of Portlets that can be dragged onto the dashboard and then moved around as required.
Enterprise Tester has many Portlets:
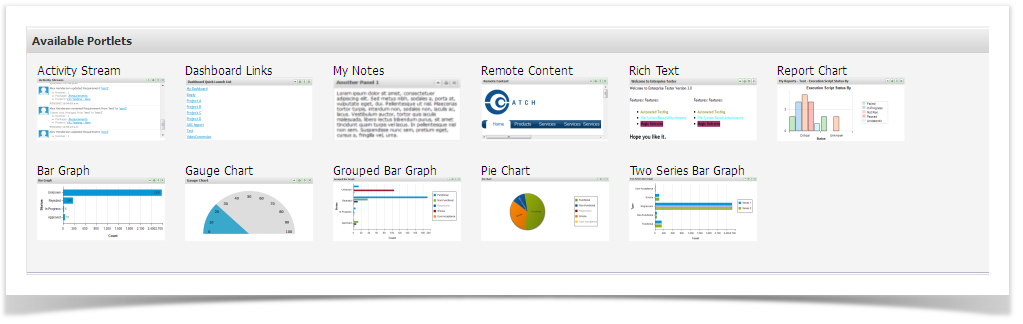
Activity Streams | Allows events to be posted to the dashboard |
Dashboard Links | Allows fast access to other dashboards |
My Notes | Allows you to add notes to the Dashboard |
Remote Content | Allows the display of content from a URL page |
Rich Text | Allows editable content using a rich text editor |
Report Chart | Classic Reports - displays charts form any of the configured reports |
Bar Graph | Displays a graph from underlying saved search/query criteria |
Gauge Chart | Displays a chart from underlying saved search/query criteria |
Grouped Bar Graph | Displays a graph from underlying saved search/query criteria |
Pie Chart | Displays a chart from underlying saved search/query criteria |
Two Series Bar Graph | Displays a graph from underlying saved search/query criteria |
To add a portlet to your dashboard:
- Drag the required portlet onto your dashboard.
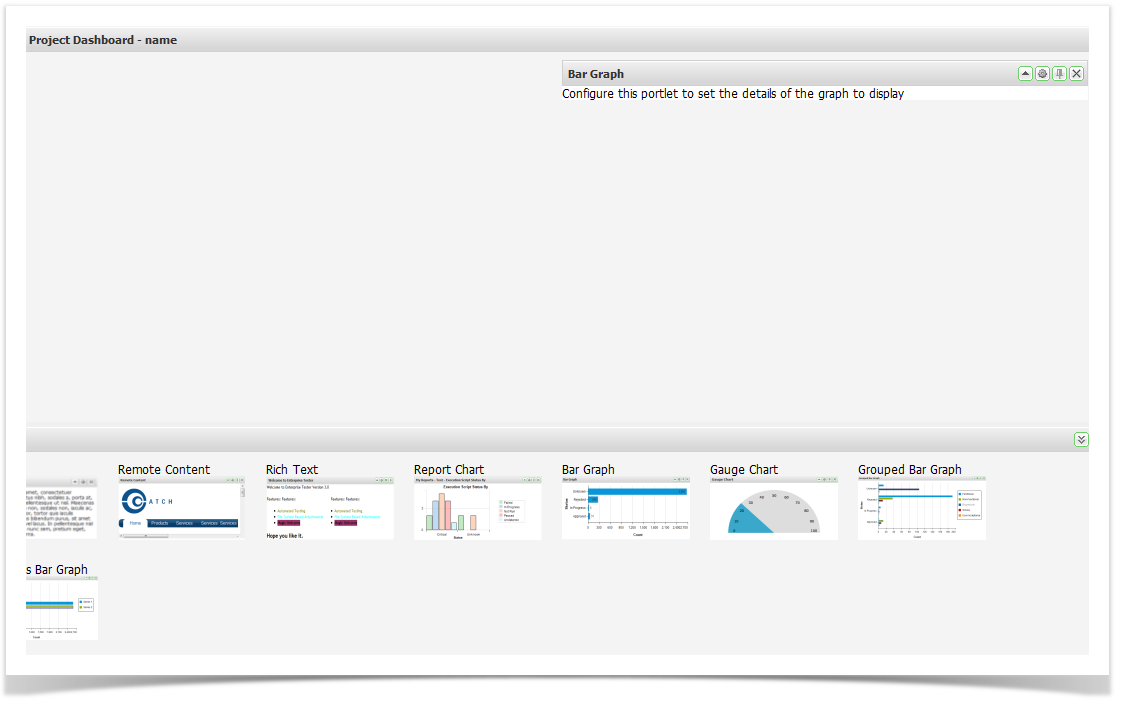
- When a blue zone is displayed, release the portlet to add it to the screen.