To view the automation results that were most recently imported you can either double click on the run in the execution set summary grid or right click on the automated script in the execution set on the Explorer tab in the Tree view navigator and select View Last Run View Automated Test Assignment.
The Automated Test Results screen will open and default to display the ‘View Run Report Summary’ Summary tab.
The following tabs are available:
...
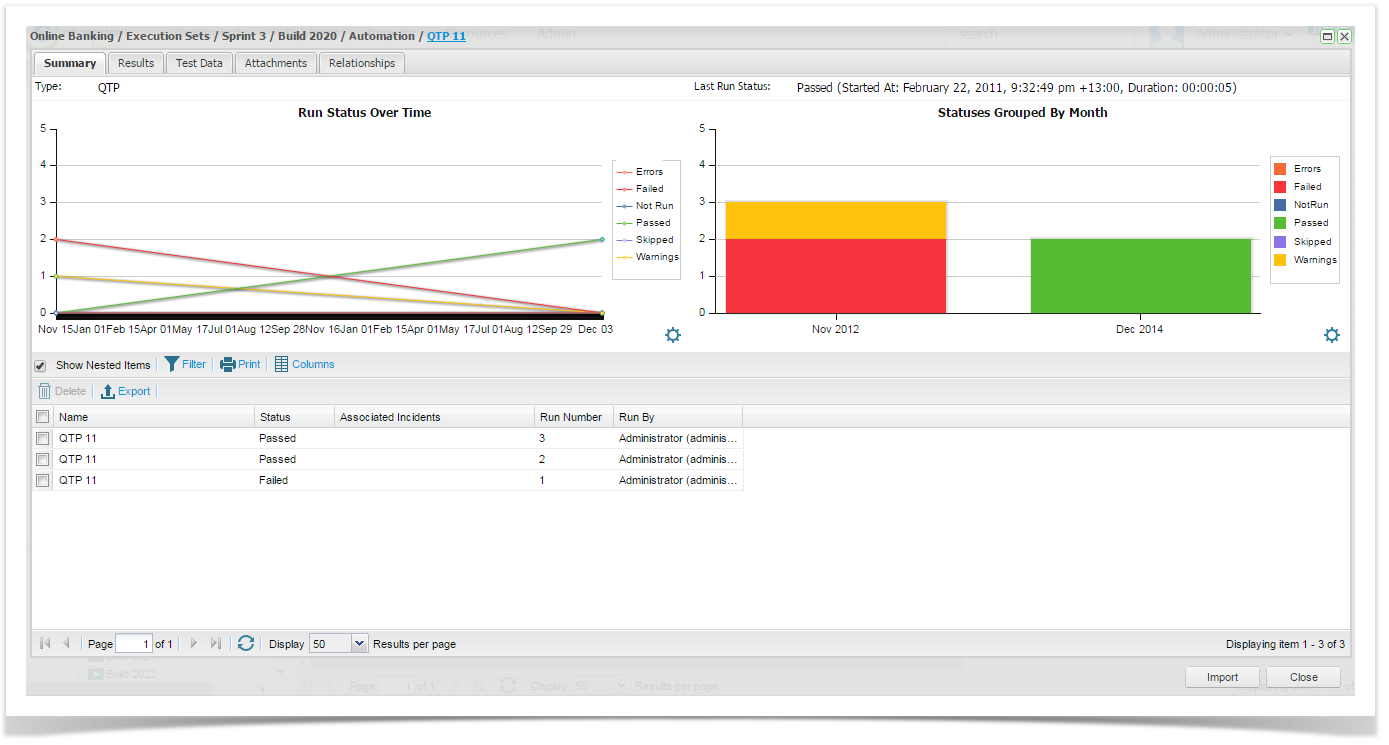
The Summary tab lists all import information. This information is sourced from the imported automated test results and also from the information the user has entered when importing these scripts into Enterprise Tester. The summary screen provides 2
The Summary tab provides two charting widgets showing the Run Status Over time Time and Status Group by Date Day ( widget is configurable and you can select the field or the date parameter to chart against).
The Summary tab also provides a summary grid of all run results for this automated test script assignment. Similar to other summary screen grids, the run history grid is configurable. You can select the columns to display or filter the results using TQL.
Results Tab
The Results Tab tab provides a tree view of the results of your automated test run. You can drill down to the detail in each node. In
In the top right corner is a status filter where you can select on the status that you want to be displayed e.g. only failed and warnings. This will allow you to quickly filter your results set to only the relevant statuses for review.
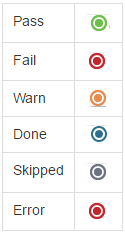
Each node has an icon indicating results:
| Pass |  |
| Fail |  |
| Warn |  |
| Done |  |
| Skipped |  |
| Error | |
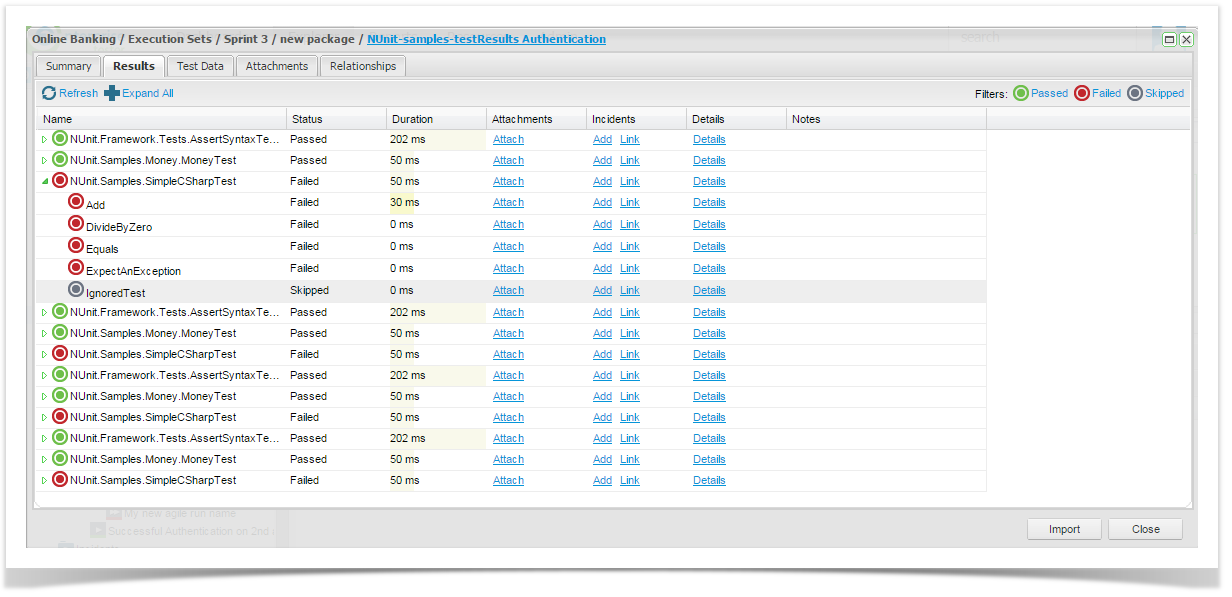
Users can add attachments, add and link incidents and view the node details via the screen.
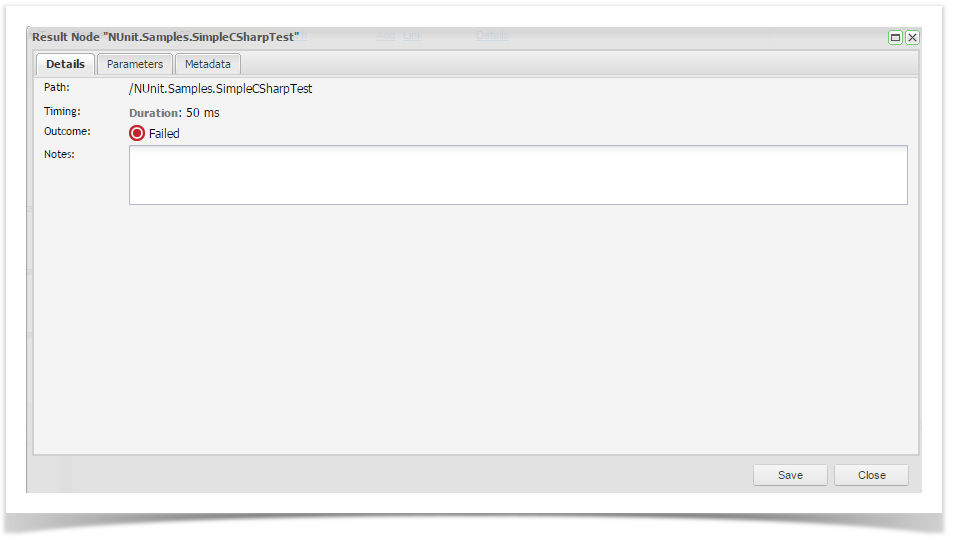
If a user clicks node details a Result Node screen is displayed with the following tabs:
- Details – high level information relating to the specific results node.
- Parameters – automated tool parameters.
- Metadata – any metadata utilized in the automated scripts.
All All of this information is sourced from the automated test tool itself. The Details Tab is displayed below. Here you
- Details – high level information relating to the specific results node. You can add notes on your results node which will display in the Results tree view in
...
- the Notes
...
- column.
The Parameters tab is displayed below:
- Parameters – automated tool parameters.
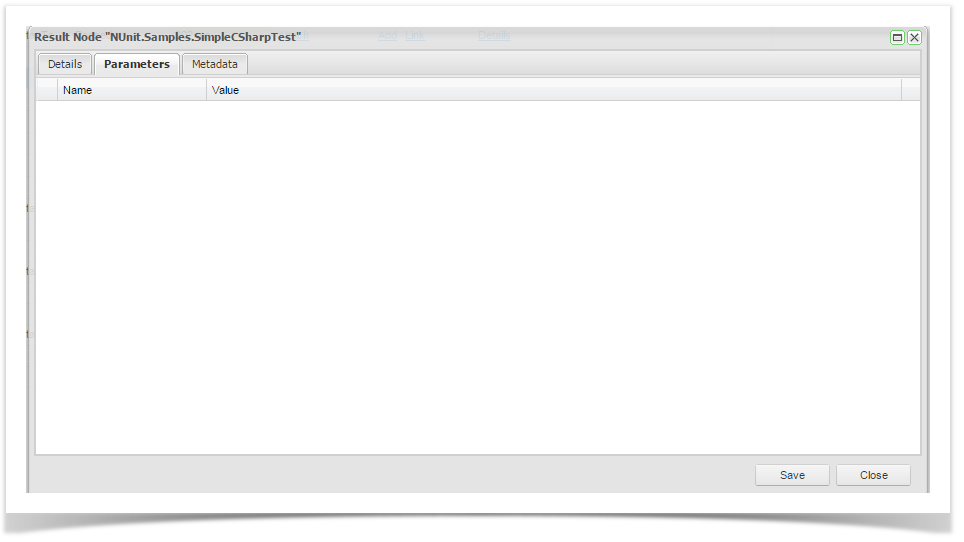
- Metadata – any metadata utilized in the automated scripts.
The Metadata tab is displayed below:
Test Data Tab
The Test Data tab displays table driven variable information from the automated test tool. Currently this function will only be displayed for imported QTP data.
...
- Attachments can be added when required from the Attachments link.
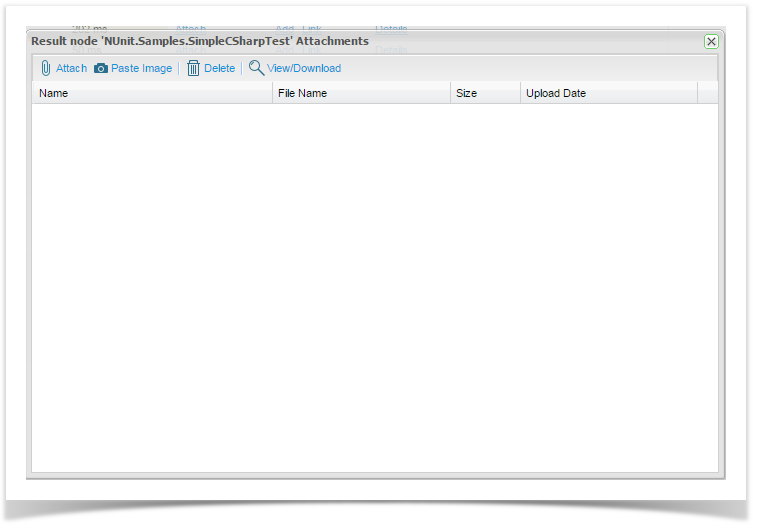
- Any relationships to the automated test, such as incidents, can also be viewed.
...