All dashboards are made up of Portlets that can be dragged onto the dashboard and then moved around as required.
The following graph portlets are available in Enterprise Tester.:
- Bar Graph
- Estimated vs Remaining Time
- Execution Script Status
- Grouped Bar Graph
- Requirement Status
- Total Scripts Run
- Two Series Bar Graph
Bar Graph
These allow you to view summary data from any of the saved queries you have created. See Searching & TQL for information on how to create these queries.
- Drag and drop Bar Graph from the available portlets onto your workspace
- Click on the Configuration button and enter the required configuration
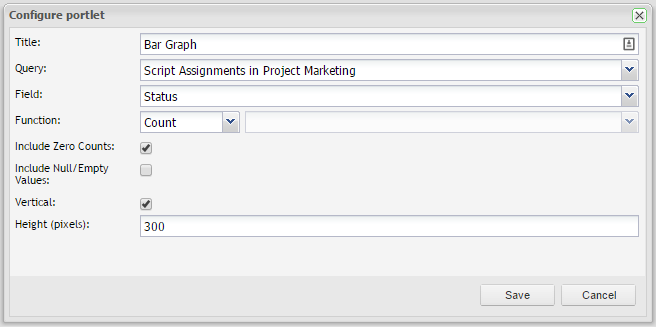
- Click on ‘Save’
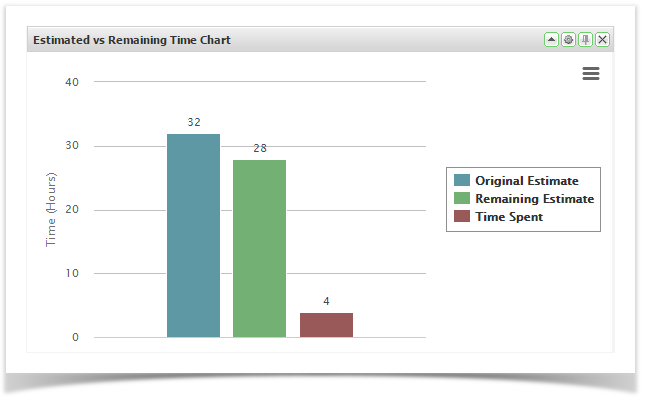
Estimated vs Remaining Time
These allow you to view summary data from a Test Execution package or by any of the saved queries you have created. See Searching & TQL for information on how to create these queries.
- Drag and drop the Estimated vs Remaining Time Graph from the available portlets onto your workspace
- Click on the Configuration button and enter the required configuration
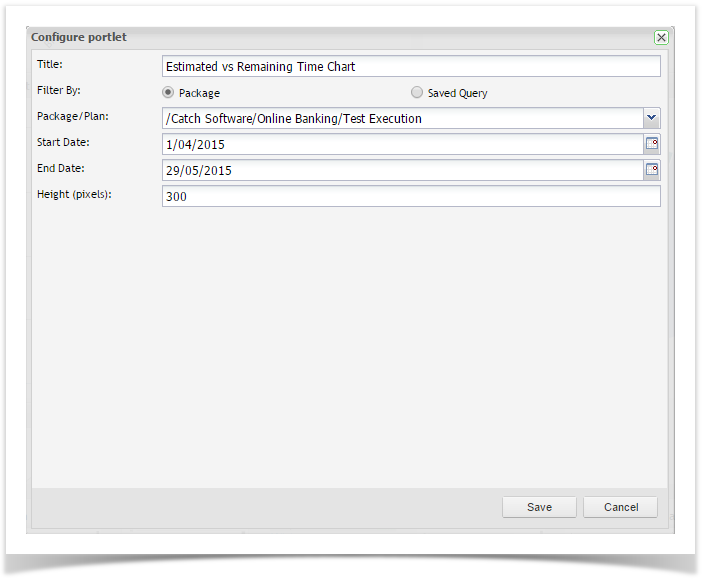
- Click on ‘Save’
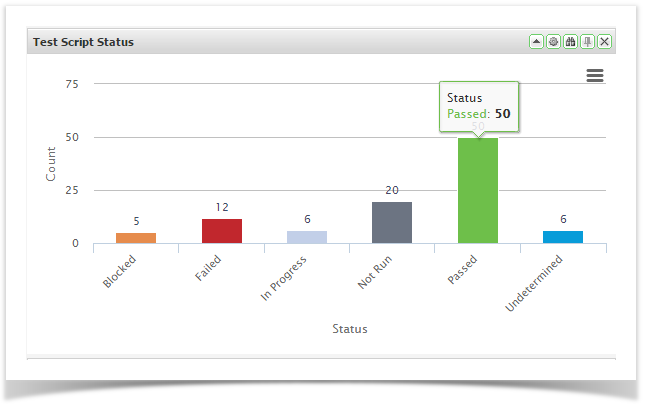
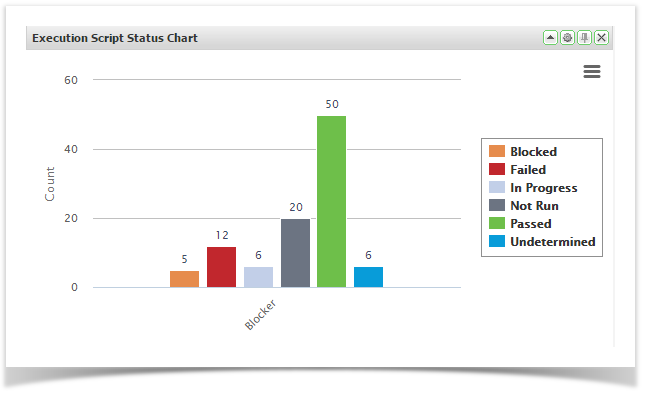
Execution Script Status
These allow you to view summary data from a Test Execution package or by any of the saved queries you have created. See Searching & TQL for information on how to create these queries.
- Drag and drop Execution Script Status Graph from the available portlets onto your workspace
- Click on the Configuration button and enter the required configuration
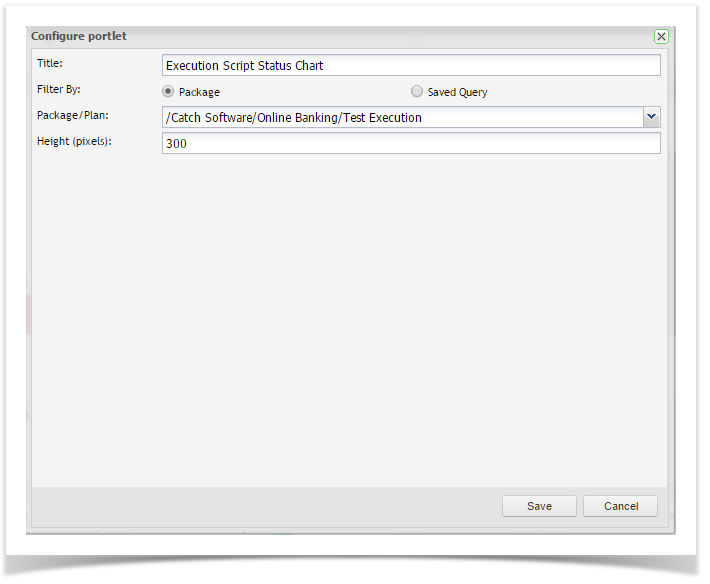
- Click on ‘Save’
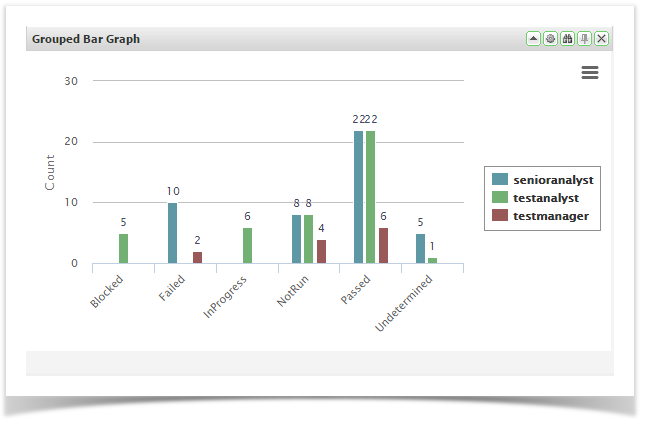
Grouped Bar Graph
These allow you to view summary data from any of the saved queries you have created. For example, this graph would be useful if you wanted to view your requirement status by priority. See
See Searching & TQL for for information on how to create these queries.
...
- Drag and drop Bar Graph from the available portlets onto your workspace
- Click on the Configuration button and enter the required configuration
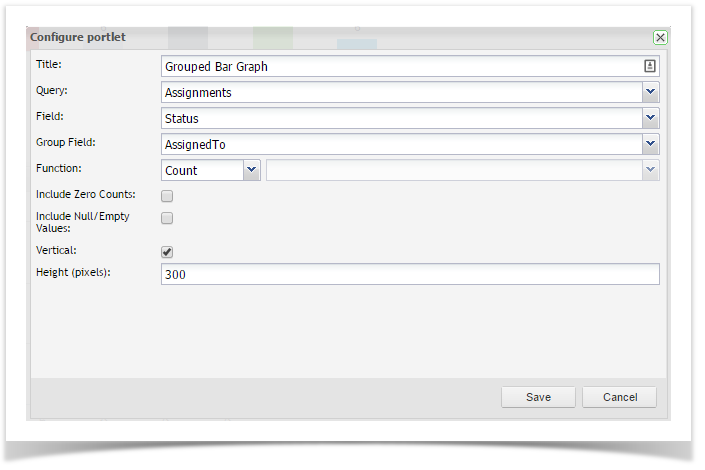
- Click on ‘Save’
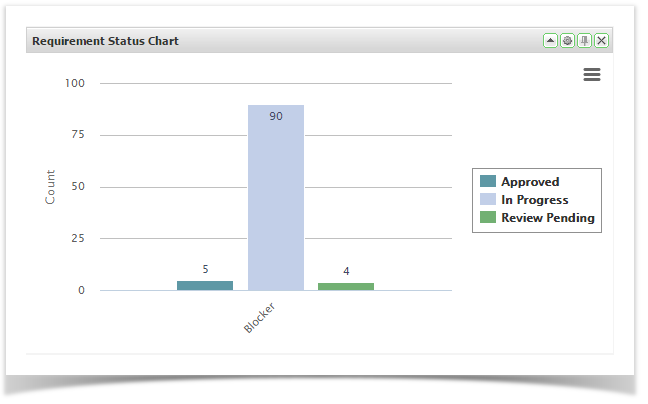
Requirement Status
These allow you to view summary data from a Requirement package or by any of the saved queries you have created. See Searching & TQL for information on how to create these queries.
- Drag and drop Requirement Status Graph from the available portlets onto your workspace
- Click on the Configuration button and enter the required configuration
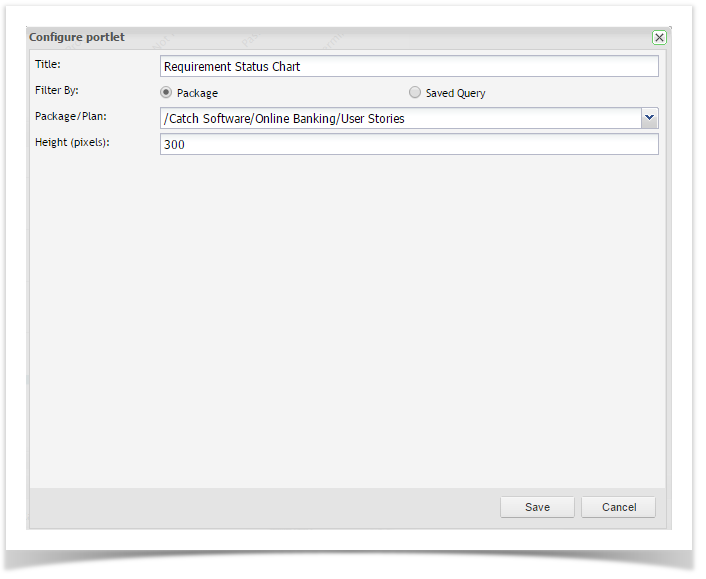
- Click on ‘Save’
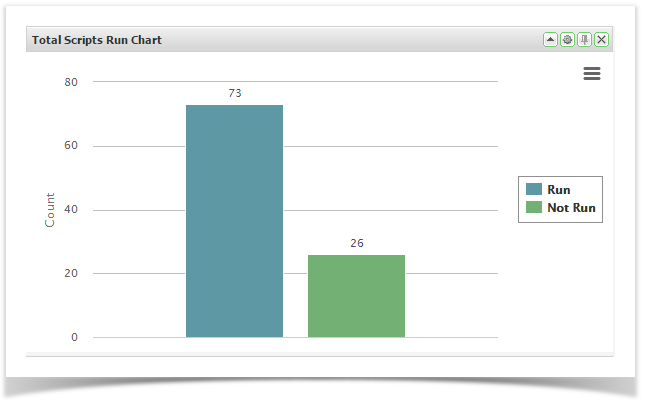
Total Scripts Run
These allow you to view summary data from a Test Execution package or by any of the saved queries you have created. See Searching & TQL for information on how to create these queries.
...
- Drag and drop Total Scripts Run Graph from the available portlets onto your workspace
- Click on the Configuration button and enter the required configuration
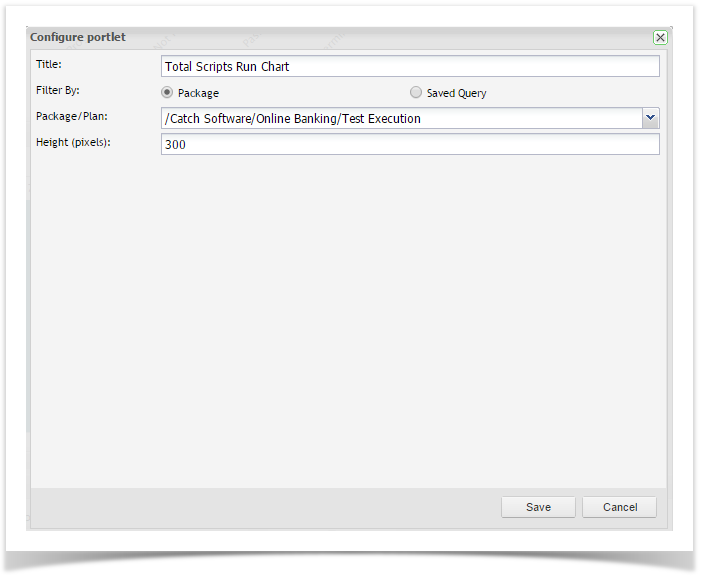
- Click on ‘Save’
...
...
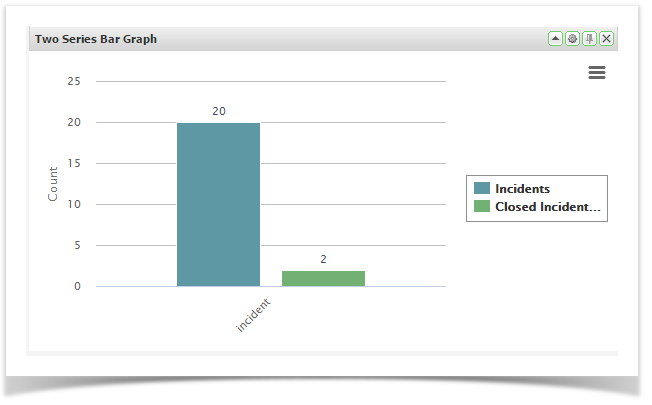
Two Series Bar Graph
These allow you to view summary data from any of the saved queries you have created. This graph is particularly useful when you want to view a comparison e.g. a count of result status of the scripts executed between 2 two different builds. See See Searching & TQL for for information on how to create these queries.
...
- Drag and drop Bar Graph from the available portlets onto your workspace
...
- Click on the Configuration button and enter the required configuration
...
...
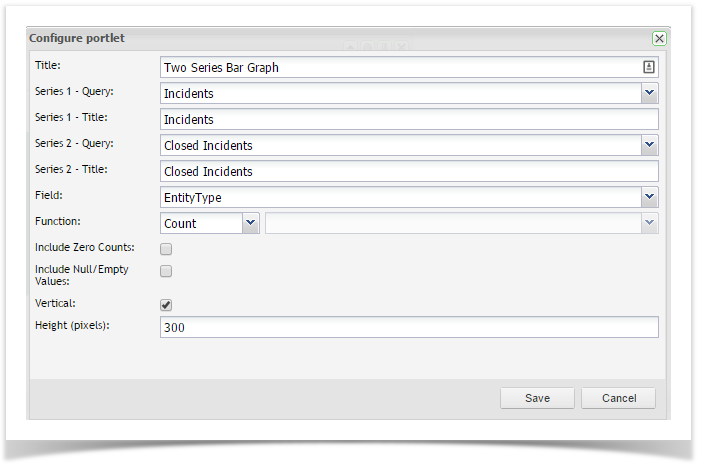
- Click on ‘Save’
...
...