...
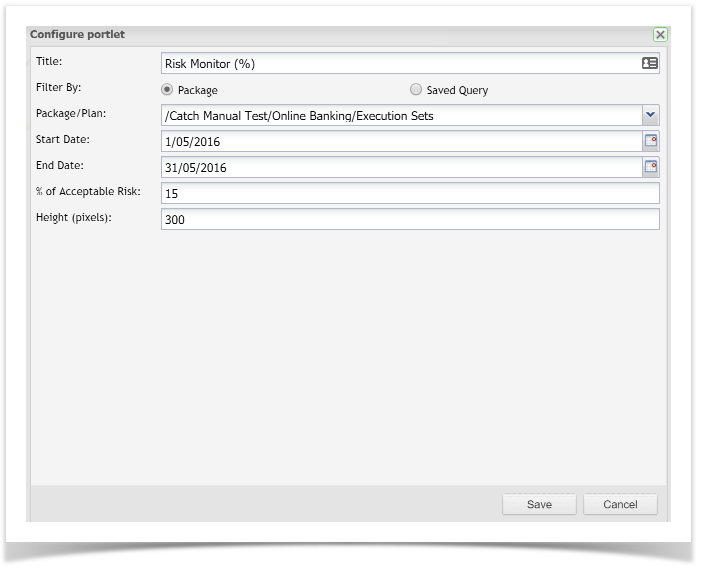
In configuration for this gadget:
- Select a package or a project query containing execution data.
- Select the date range.
- Add the % of acceptable Acceptable Risk.
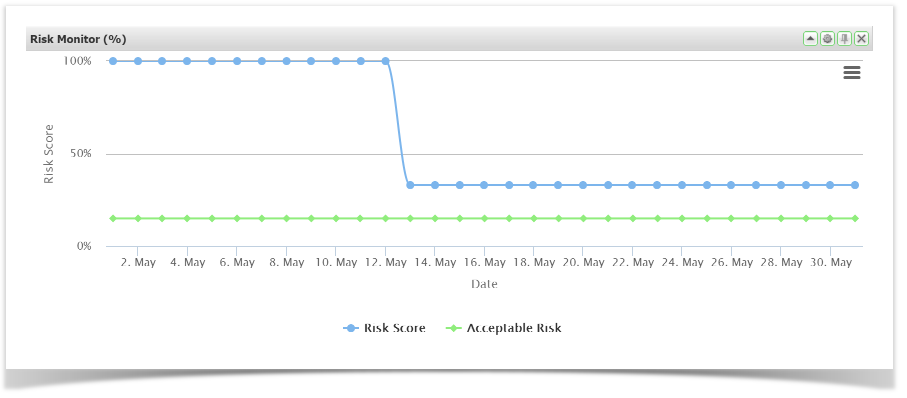
As tests are executed the actual Risk (blue line) will decrease. Testing can stop once the blue line converges with the green line.
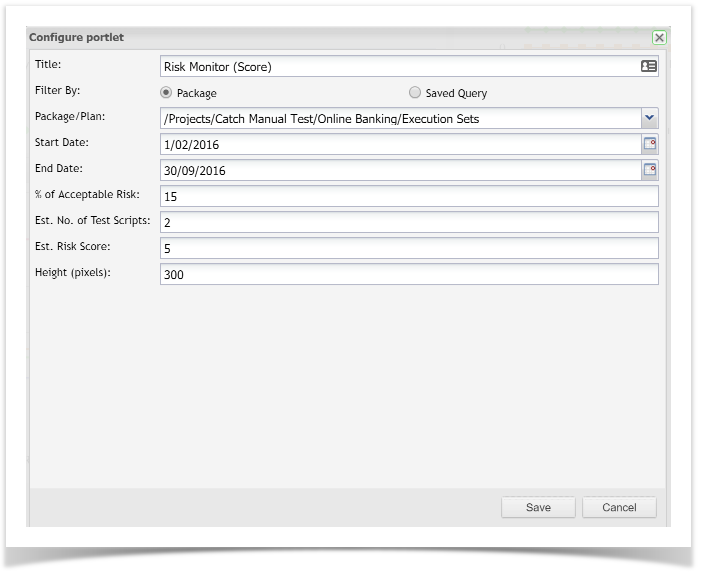
Risk Monitor (Score)
The Risk Monitor gadget displays the actual level of Risk (blue line) versus the acceptable level of Risk expressed as a percentage (green line).
In configuration for this gadget:
- Select a package or a query containing execution data.
- Select the date range.
- Add the % of Acceptable Risk.
- Estimated Number of Test Scripts
- Estimated Risk Score.
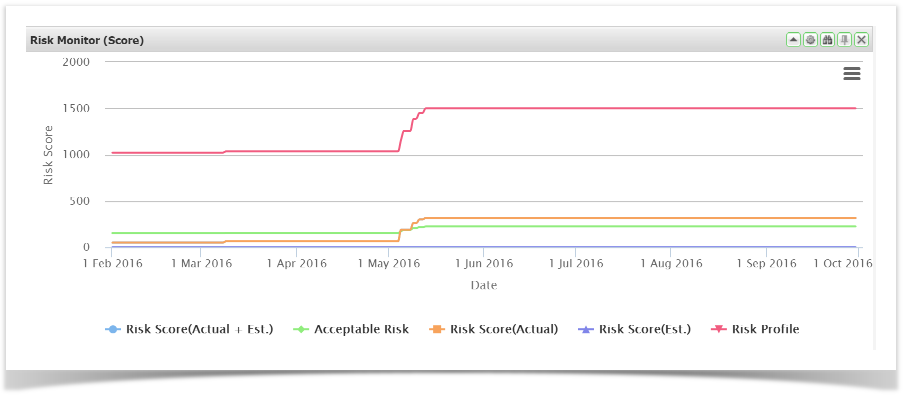
Blue Line: Risk Score (Actual + Estimated)
= Sum of actual Risk Score for all execution data selected + the total estimated Risk score. Less the number of script assignments actually executed.
Green Line: Acceptable Risk
= Represented as a percentage, as entered in the configuration screen.
Orange Line: Risk Score (Actual)
= Sum of actual Risk Score for all execution data selected.
Purple Line: Risk Score (Estimated)
= Used in planning. The estimated number of Test Scripts times the estimated Risk Score. Less Less the number of script assignments actually executed.
Red Line: Risk Profile
= Sum of actual Risk Score for all execution data selected + the total estimated Risk score.