All dashboards are made up of Portlets gadgets that can be dragged onto the dashboard and then moved around as required.
The following graph portlets gadgets are available in Enterprise Tester:
...
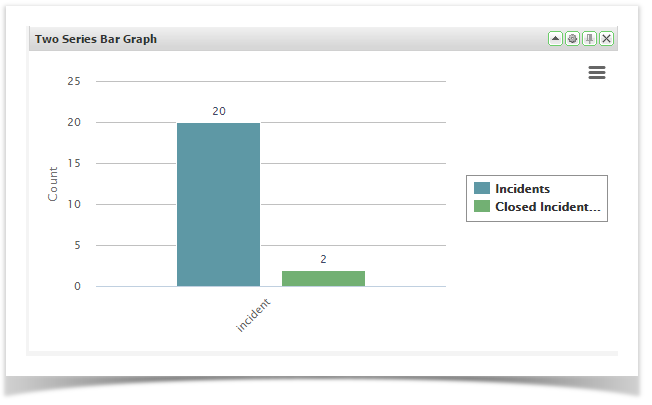
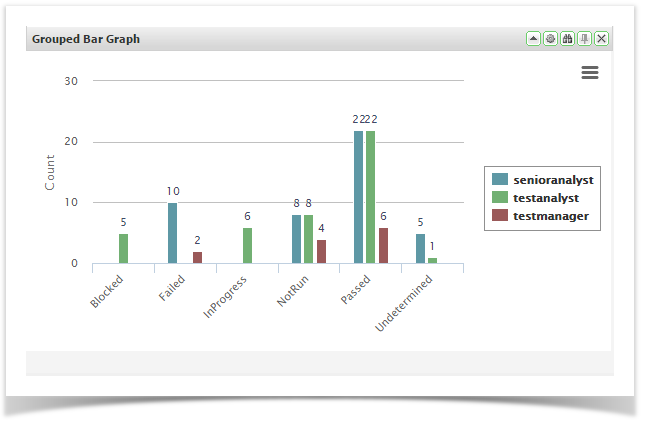
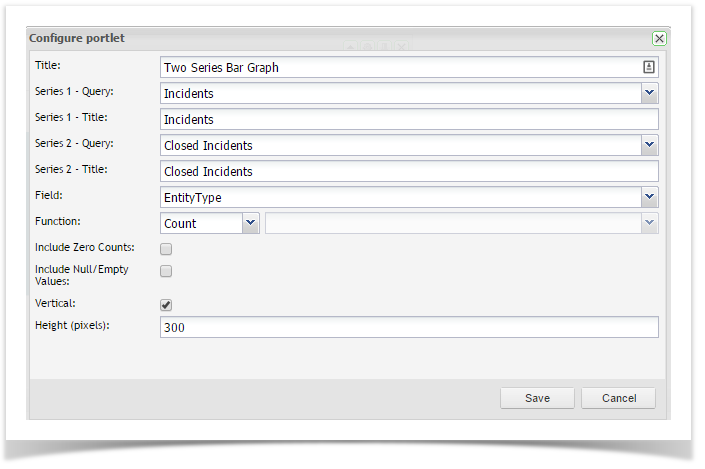
- Drag and drop Bar Graph from the available portlets gadgets onto your workspace
- Click on the Configuration button and enter the required configuration
- Click on ‘Save’
...
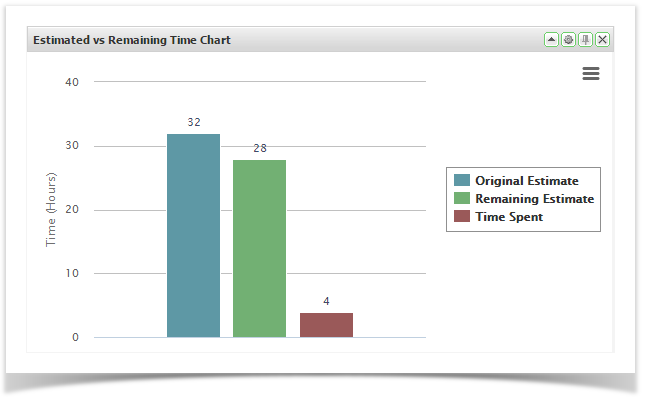
- Drag and drop the Estimated vs Remaining Time Graph from the available portlets gadgets onto your workspace
- Click on the Configuration button and enter the required configuration
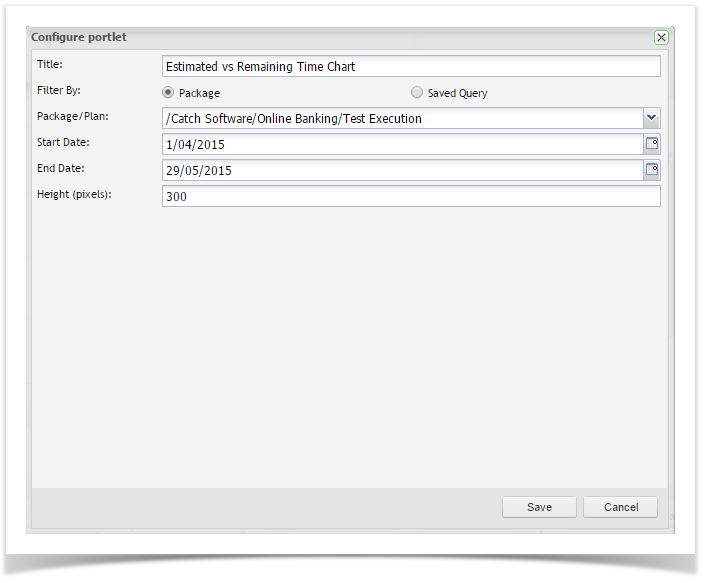
- Click on ‘Save’
...
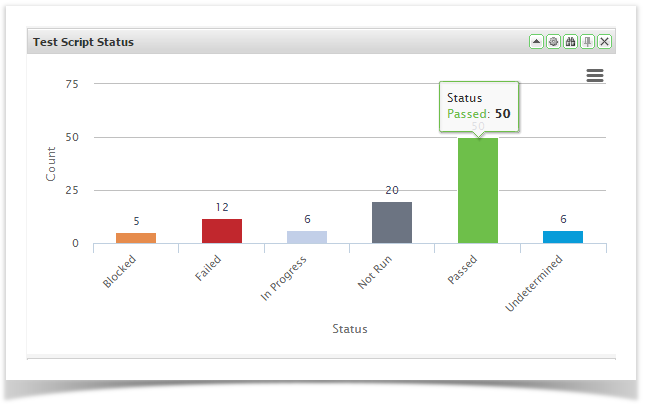
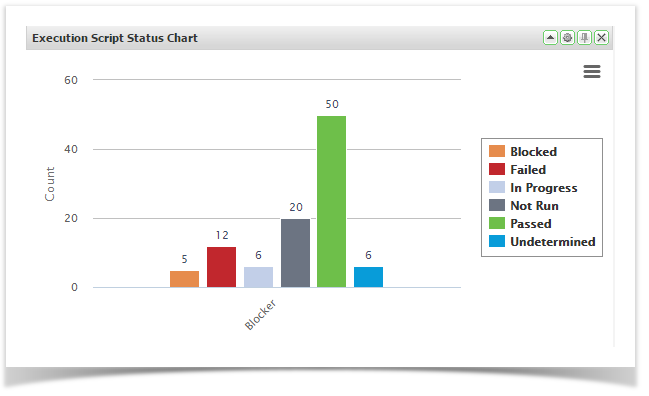
- Drag and drop Execution Script Status Graph from the available portlets gadgets onto your workspace
- Click on the Configuration button and enter the required configuration
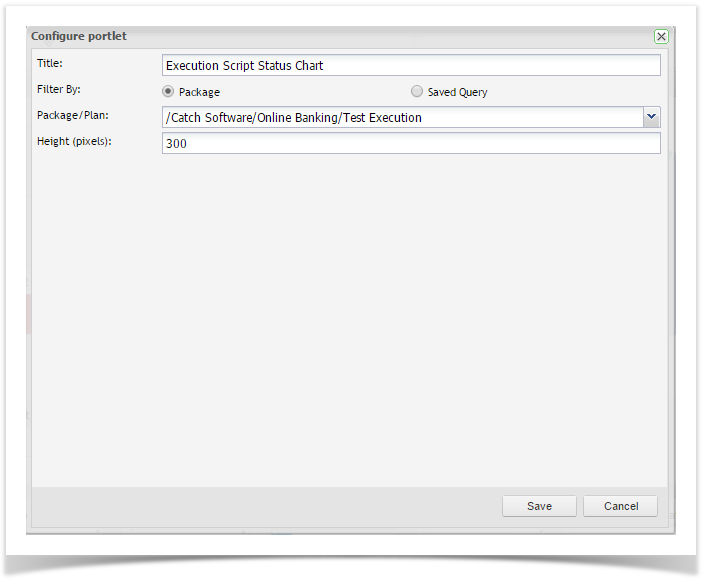
- Click on ‘Save’
...
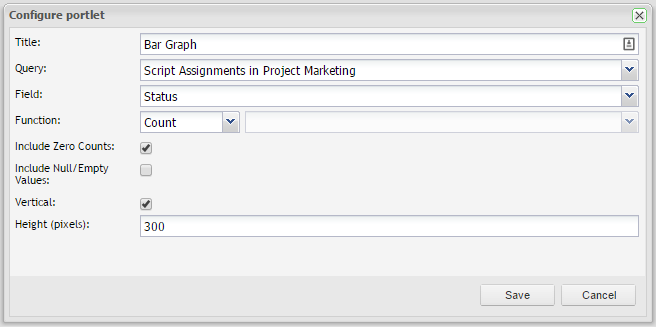
- Drag and drop Bar Graph from the available portlets gadgets onto your workspace
- Click on the Configuration button and enter the required configuration
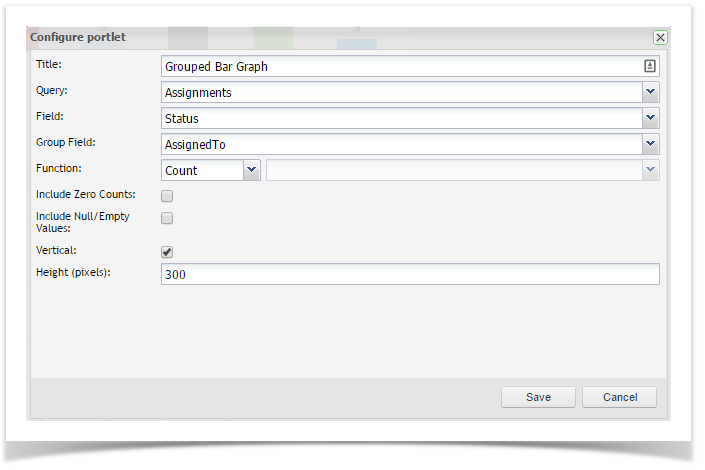
- Click on ‘Save’
...
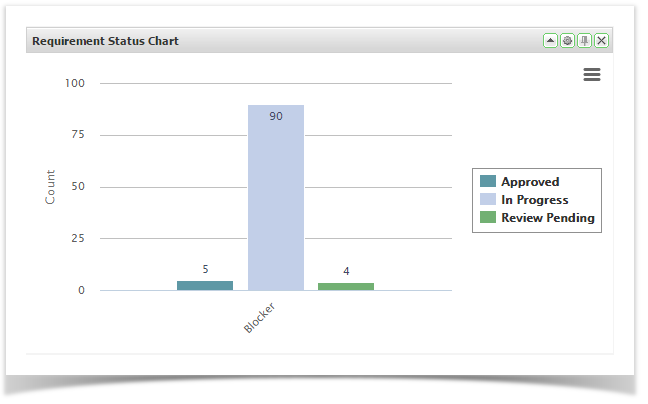
- Drag and drop Requirement Status Graph from the available portlets gadgets onto your workspace
- Click on the Configuration button and enter the required configuration
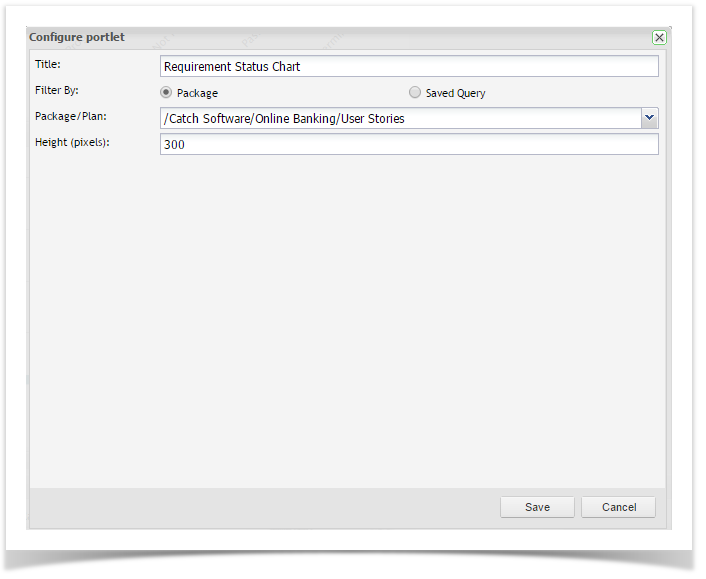
- Click on ‘Save’
...
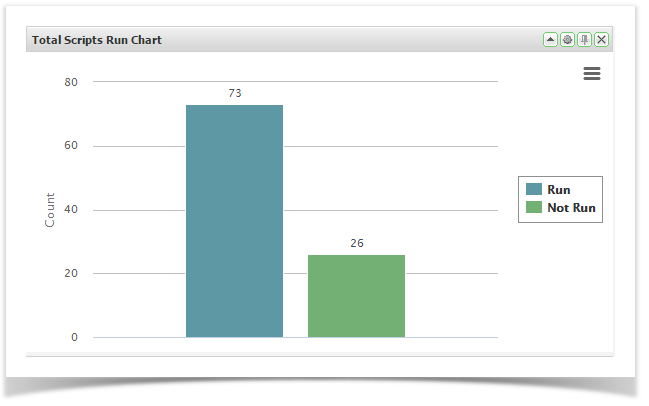
- Drag and drop Total Scripts Run Graph from the available portlets gadgets onto your workspace
- Click on the Configuration button and enter the required configuration
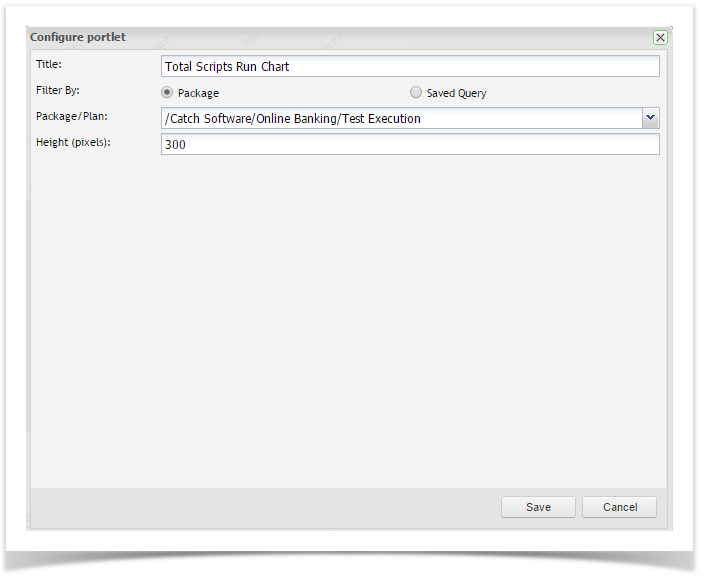
- Click on ‘Save’
...
- Drag and drop Bar Graph from the available portlets gadgets onto your workspace
- Click on the Configuration button and enter the required configuration
- Click on ‘Save’