Collecting Performance Information from Browsers
The follow provides the steps required to collect performance/request information from your web browser to assist in troubleshooting.
Safari
- Launch Safari
- Open Safari‟s Preferences by selecting Safari -> Preferences (the Safari menu is the one with a little gear icon).
- Click the „Advanced‟ tab.
- Place a check mark next to “Show Develop menu in menu bar”
- You can now hit "ALT" to bring up the menu, then go to the develop menu and select "web inspector".
Now go to the Timeline tab, at the bottom of the window:
- Uncheck "Scripting" and "Rendering"
- Click the record button
While recording move around Enterprise Tester, clicking on parts of UI i.e. expanding packages, loading scripts, saving scripts etc. – focusing on the areas where you are seeing poor performance, and do this for a couple of minutes.
Click record again to stop.
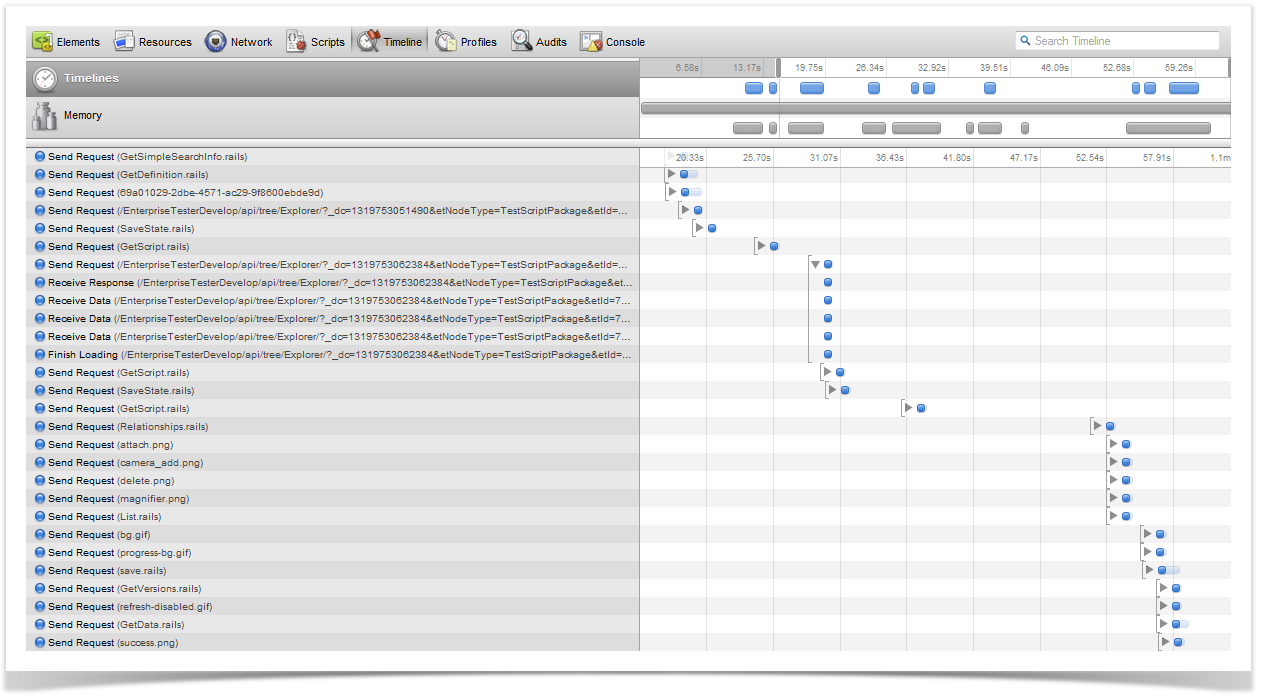
Take a screen shot, this will give an overall picture of how long/number of requests being made:
Next switch to the "Network" tab.
At the bottom click on "XHR".
Repeat the above tests, clicking on scripts, expanding tree nodes, updating and then saving.
After a minute or so you should have a number of requests recorded.
Right click on the list of requests and select "Copy All as HAR".
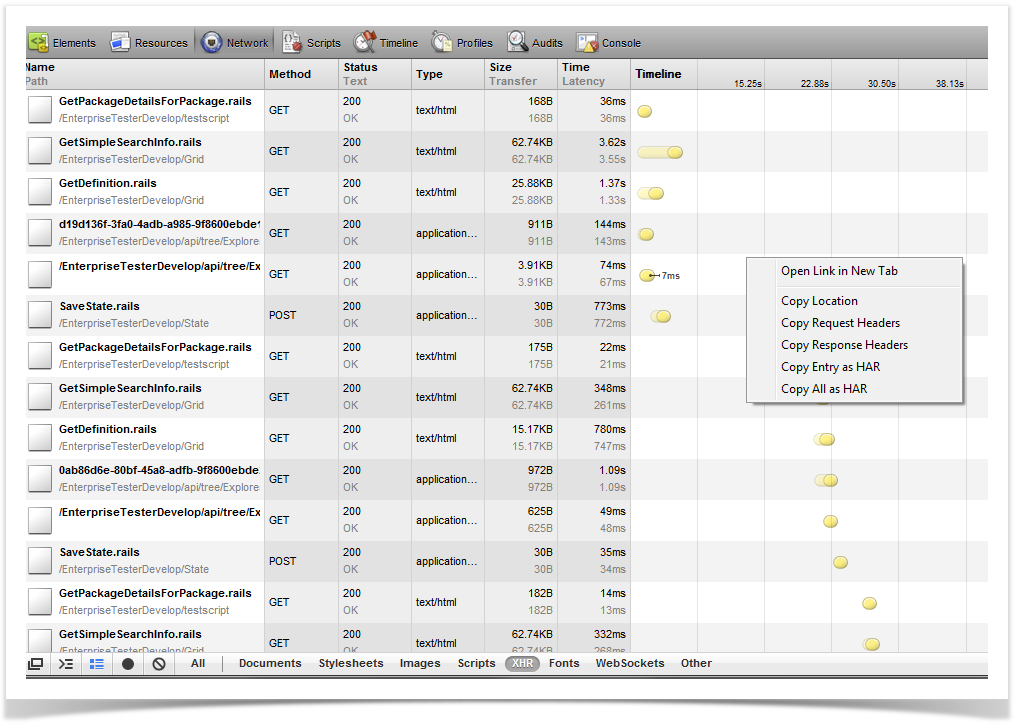
This will put all the request info on the clipboard, now create a new text file with the extension “.har” in notepad and paste in the text. Save the file and email it to us for analysis.
Google Chrome
For Google chrome (which is also based on webkit, just like Safari) you can follow the same steps as above for Safari, with two key differences:
- To load the development tools use CTRL+SHIFT+I
- When saving the request info, just right-click and select "Save All as HAR", which will prompt you for a location to save the file (so you don't need to copy/paste text into a text editor, as you do for Safari).
FireFox
For Firefox you will need to install firebug + NetExport.
Firebug can be installed into firefox via Tools -> Add Ons.
Net Export can be installed by going here: http://getfirebug.com/releases/netexport/
And downloading the latest version of the .XPI file, you can then load the plugin by going to Tools -> Add On, click the gear icon and selecting "Install Add-on from file", then browsing to the location where you saved the XPI file.
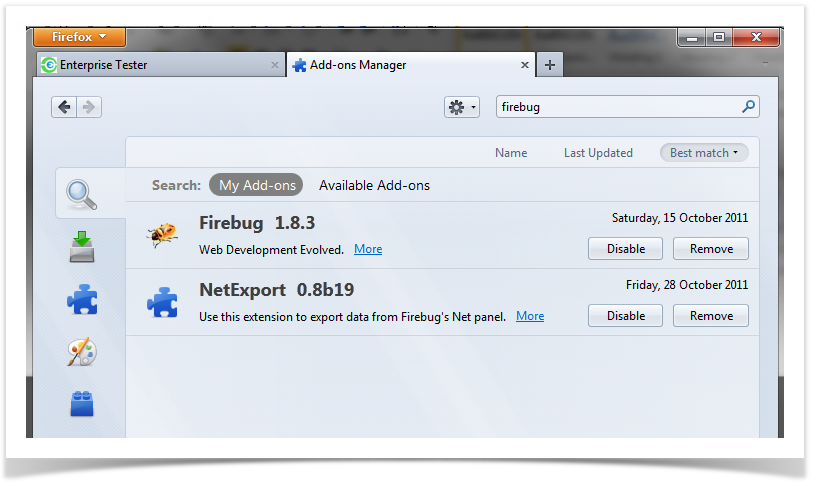
Once installation is completed you should be able to confirm that both plugins are installed/enabled:
Return to Enterprise tester, and click on the "Firebug" icon in the top right hand corner of the browser.
The firebug window should appear at the bottom of the browser.
Now click on the "Net" tab.
Click the "enable this tab" link.
Now access Enterprise Tester, login, expand tree nodes, edit & save scripts etc. for a couple of minutes.
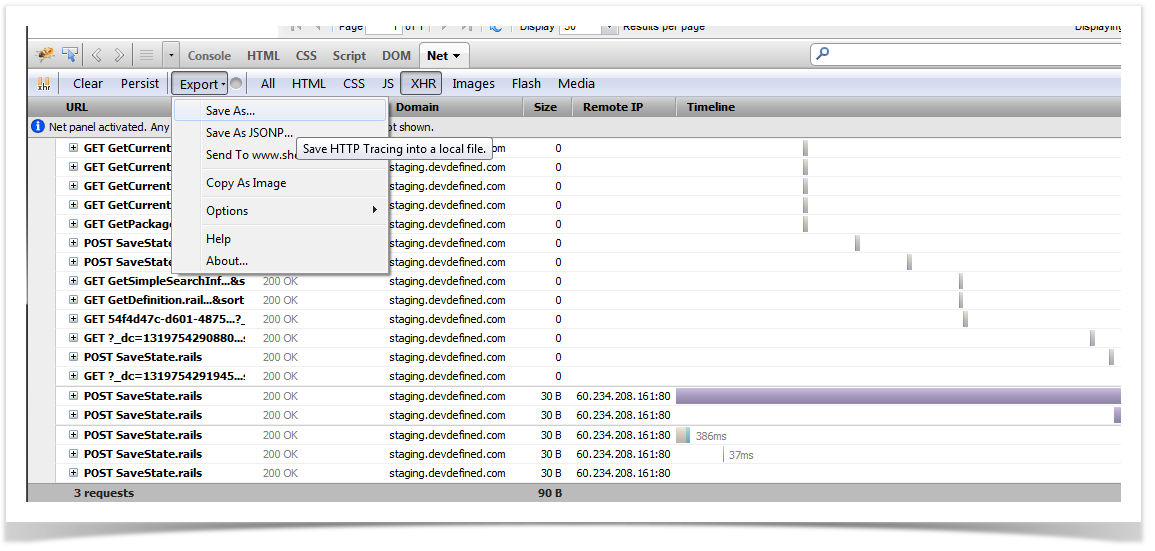
Once complete click the "Export" button just below the "Net" tab, and select "Save As...", you can then save a HAR file to your local disk, which can then be emailed to the Catch Support Team at support@catchlimited.com for analysis.