All dashboards are made up of Portlets that can be dragged onto the dashboard and then moved around as required.
The following over time portlets are available in Enterprise Tester:
- Actual vs Estimated Time
- Burndown Chart
- Incident Numbers
- Incident Rate
- Tests Completed
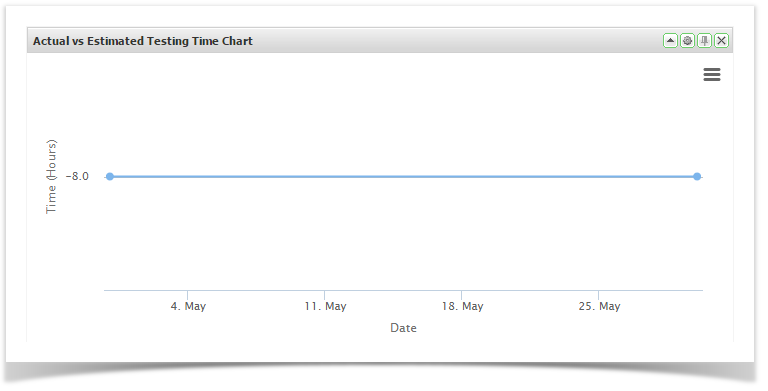
Actual vs Estimated Time
These allow you to view summary data from any of the saved queries you have created. You can create portlets for either a specific execution set package / folder or for a specific set of data by using a saved query.
See Searching & TQL for information on how to create these queries.
- Drag and drop Actual vs Estimated Time from the available portlets onto your workspace
- Click on the Configuration button and enter the required configuration
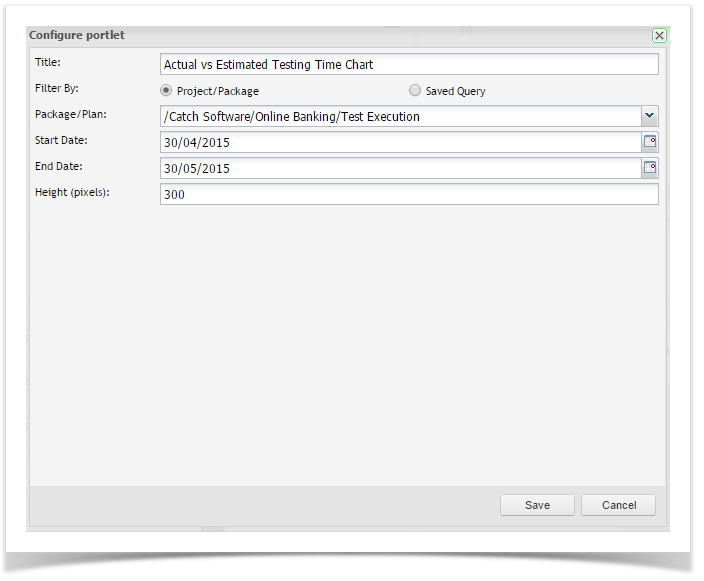
- Click Save
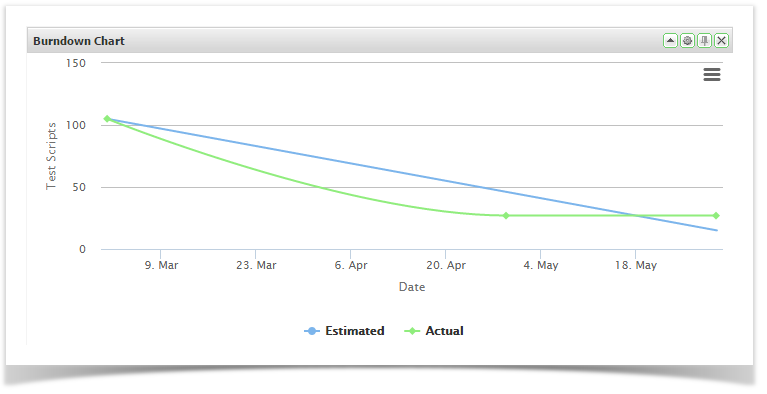
Burndown Chart
These allow you to view summary data from any of the saved queries you have created. You can create portlets for either a specific execution set package/folder or for a specific set of data by using a saved query.
See Search & Query Language for information on how to create these queries.
- Drag and drop the Burndown Chart from the available portlets onto your dashboard
- Click on the Configuration button
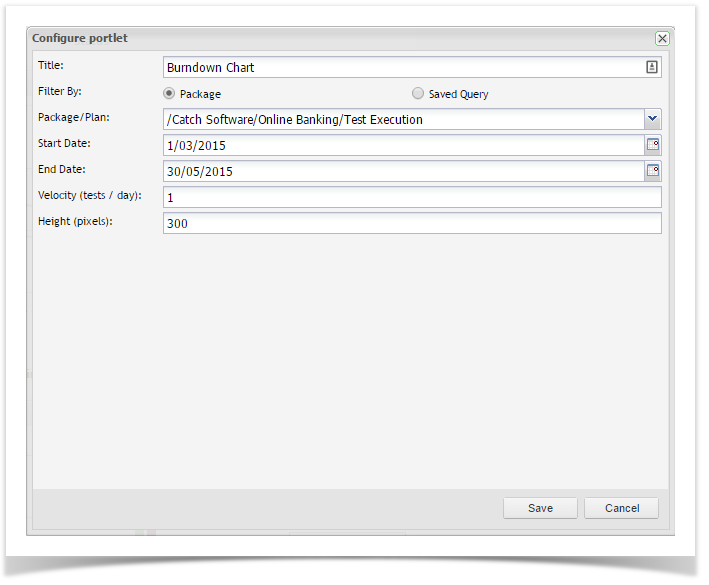
- Enter in a title for the chart. This will be displayed on the title bar of the portlet on your dashboard
- You can select the data you wish to chart by selecting either an execution set package or a saved query
- Enter in the start and end dates. By default these fields will default to today's date and the date one month later, respectively
- Enter in the velocity (tests/day)
- You can select to change the height of the portlet. The height for all portlets defaults to 300 pixels
- Once you have completed the fields, click on Save and the portlet will be displayed
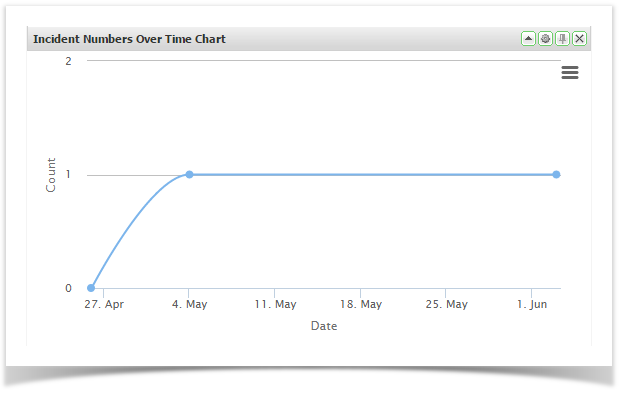
Incident Numbers Over Time
These allow you to view summary data from any of the saved queries you have created. You can create portlets for either a specific execution set package/folder or for a specific set of data by using a saved query.
See Searching & TQL for information on how to create these queries.
- Drag and drop Incident Numbers from the available portlets onto your workspace
- Click on the Configuration button and enter the required configuration
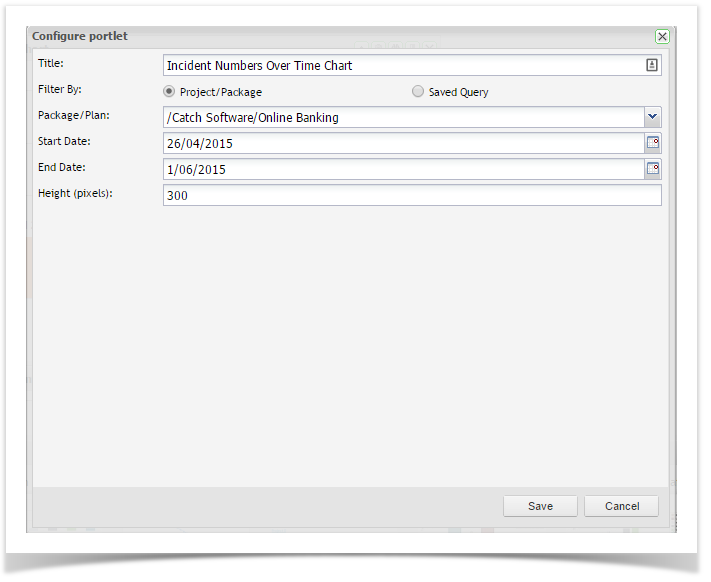
- Click Save
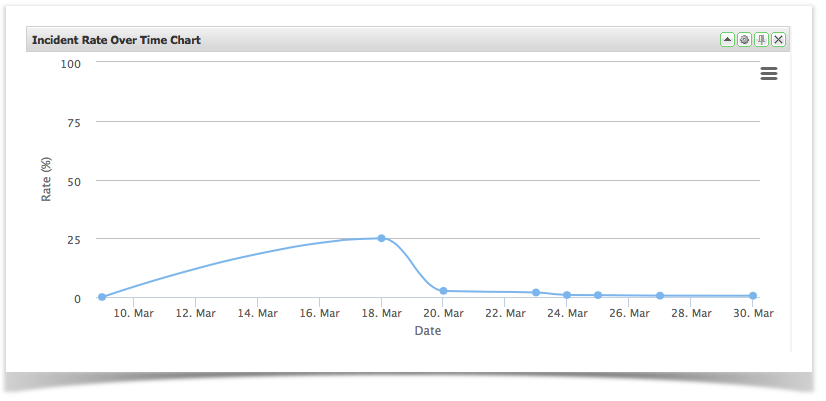
Incident Rate Over Time
These allow you to view summary data from any of the saved queries you have created. You can create portlets for either a specific execution set package/folder or for a specific set of data by using a saved query.
See Searching & TQL for information on how to create these queries.
- Drag and drop Incident Rate from the available portlets onto your workspace
- Click on the Configuration button and enter the required
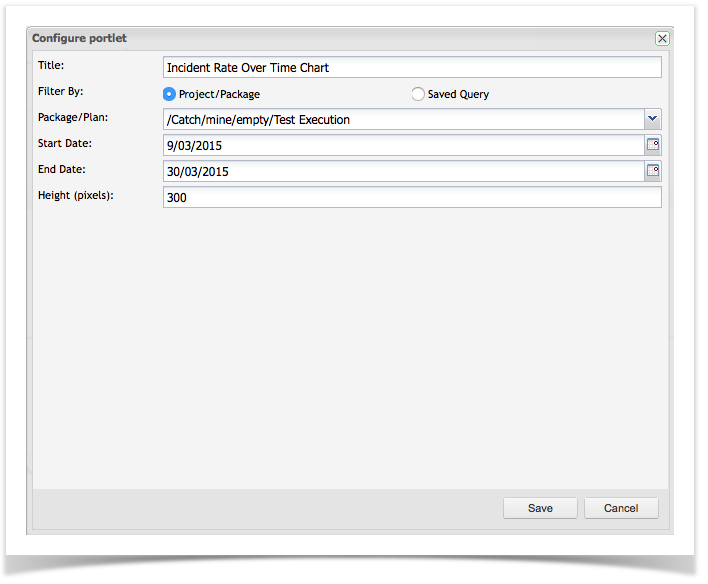
- Click Save
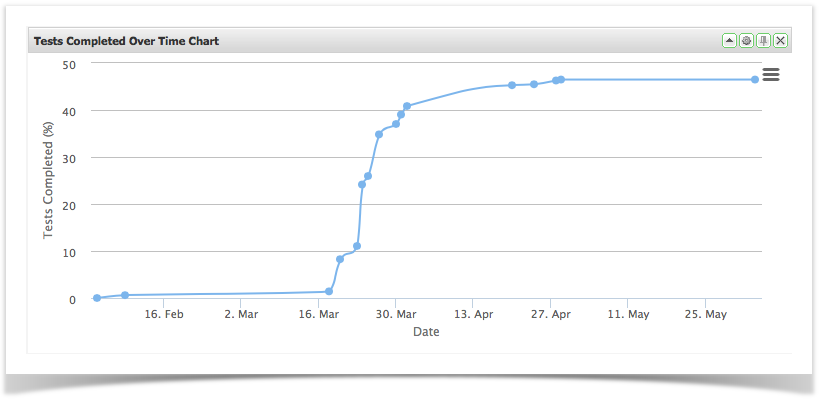
Tests Completed Over Time
These allow you to view summary data from any of the saved queries you have created. You can create portlets for either a specific execution set package/folder or for a specific set of data by using a saved query.
See Searching & TQL for information on how to create these queries.
- Drag and drop Tests Completed from the available portlets onto your workspace
- Click on the Configuration button and enter the required configuration
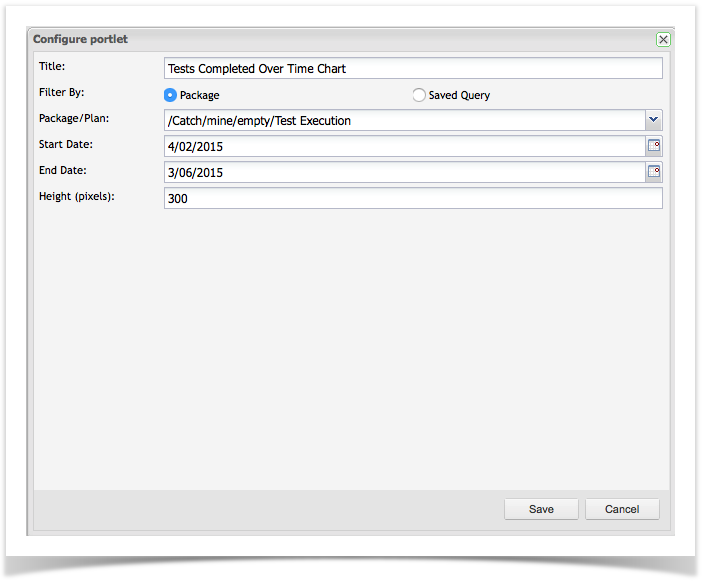
- Click Save