You can set up dashboards to show summary information related to your test projects or for your organization overall.
...
New dashboards are blank and ready for your to customize using the available portlets. Portlets can be dropped onto the dashboard and then moved around as required.
Portlets are accessed by clicking anywhere on the bar that stretches along the bottom, this will expand the Portlet selection area.
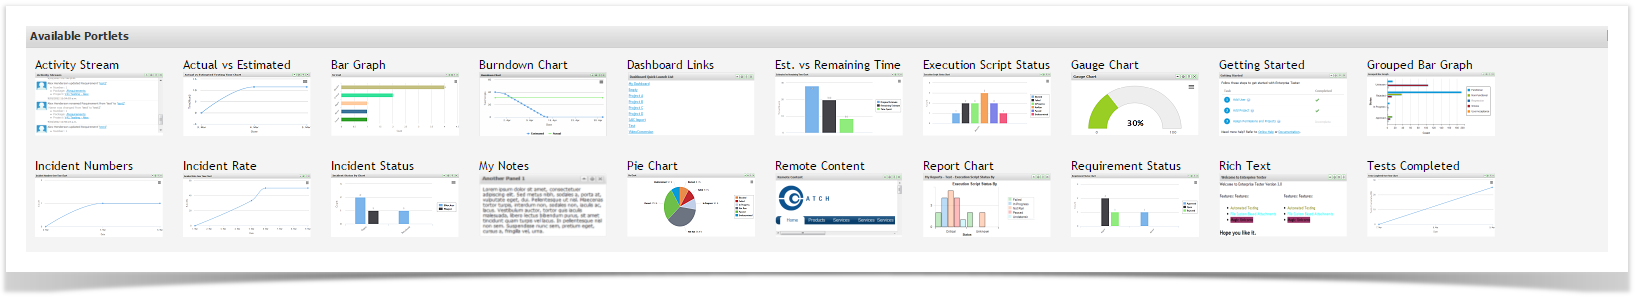
Enterprise Tester has many Portlets: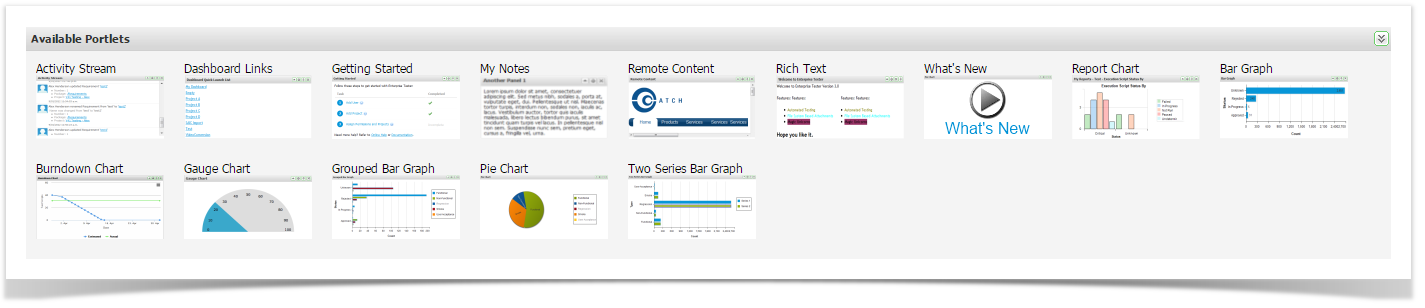
Activity Streams | Allows events to be posted to the dashboard | ||
Dashboard Links | Allows fast access to other dashboards | ||
My Notes | Allows you to add notes to the Dashboard | ||
Remote Content | Allows the display of content from a URL page | ||
Rich Text | Allows editable content using a rich text editor | ||
| Actual vs Estimated | Displays the actual versus estimated duration for script execution | Report Chart | Classic Reports - displays charts form any of the configured reports|
| Bar Graph | Displays a graph from underlying saved search/query criteria | ||
| Burndown Chart | Displays the actual versus estimated work remaining over time | ||
Dashboard Links | Allows fast access to other dashboards | ||
| Est vs Remaining Time | Displays the estimated versus remaining duration for script execution | ||
| Execution Script Status | Displays execution status from underlying saved search/query criteria | ||
| Gauge Chart | Displays a chart from underlying saved search/query criteria | ||
| Getting Started | Links to getting started tasks | ||
| Grouped Bar Graph | Displays a graph from underlying saved search/query criteria | ||
| Incident Numbers | Displays a graph of Incident Numbers over time | ||
| Incident Rate | Displays a graph of Incident Rate over time | ||
| Incident Status | Displays a graph of Incident Statuses | ||
My Notes | Allows you to add plain-text notes to the Dashboard | ||
| Pie Chart | Displays a chart from underlying saved search/query criteria | ||
Remote Content | Allows the display of content from a URL page | ||
| Report Chart | Classic Reports - displays charts form any of the configured reports | ||
| Requirement Status | Displays a graph of Requirement Status | ||
Rich Text | Allows editable content using a rich text editor | ||
Tests Completed | Displays a graph of Tests Completed | ||
Total Scripts Run | Displays a graph of Total Scripts Run | ||
Two Series Bar Graph | Displays a graph from underlying saved search/query criteria | ||
| What's New | Enterprise Tester 'What's New' video |
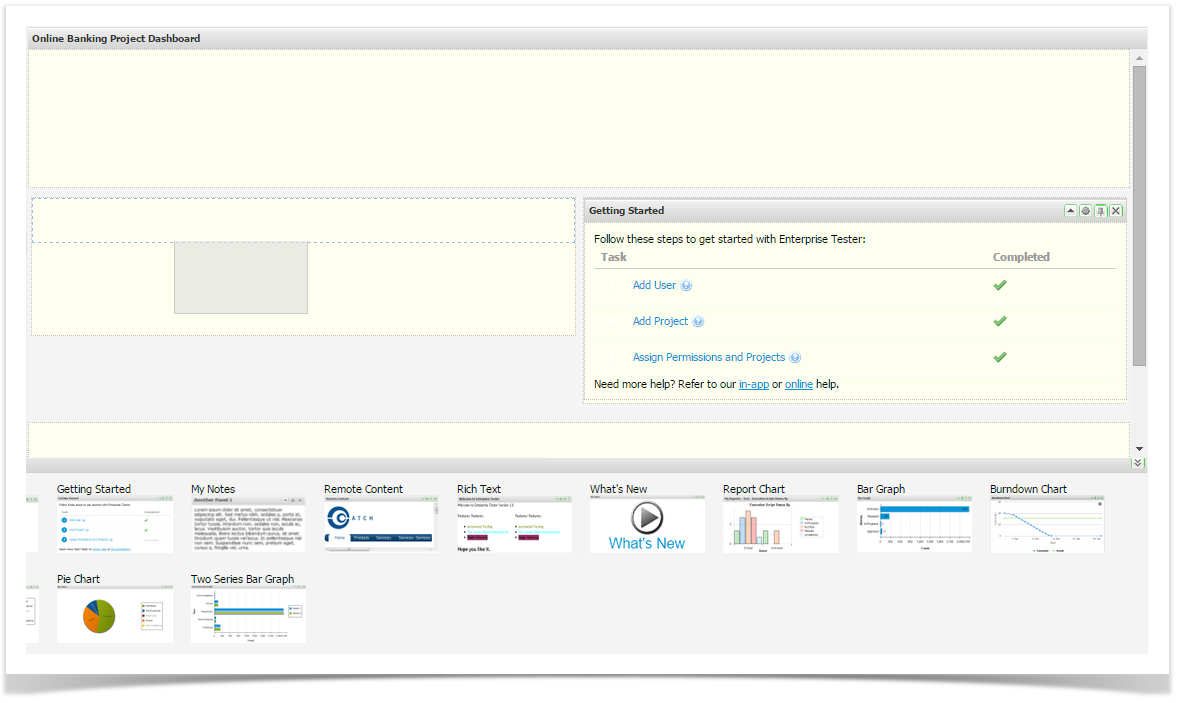
Add Portlets to your Dashboard
To add a portlet to your dashboard:
- Expand the portlet selection area by clicking anywhere on the bar visible at the bottom of the page
- Drag the required portlet onto your dashboard.
- When a blue zone is displayed, release the portlet to add drop it to on the screen.
Portlet Output and Printing
For all portlets except the "Report Chart" portlet you can create JPEG or PNG output or create Print output. ![]() You must have internet access for the outputs to render.
You must have internet access for the outputs to render.
- Click the hamburger (three horizontal lines) in the top right hand corner on the chart.
- Select Print, JPEG or PNG options.