...
For all portlets except the "Report Chart" you can create JPEG or PNG output or , create Print output. output or export the entire dashboard to a pdf file.
![]() You must have internet access for the outputs to render.
You must have internet access for the outputs to render.
- Click the hamburger (three horizontal lines) in the top right hand corner on the chart.
- Select one of the following options - Print, JPEG or PNG.
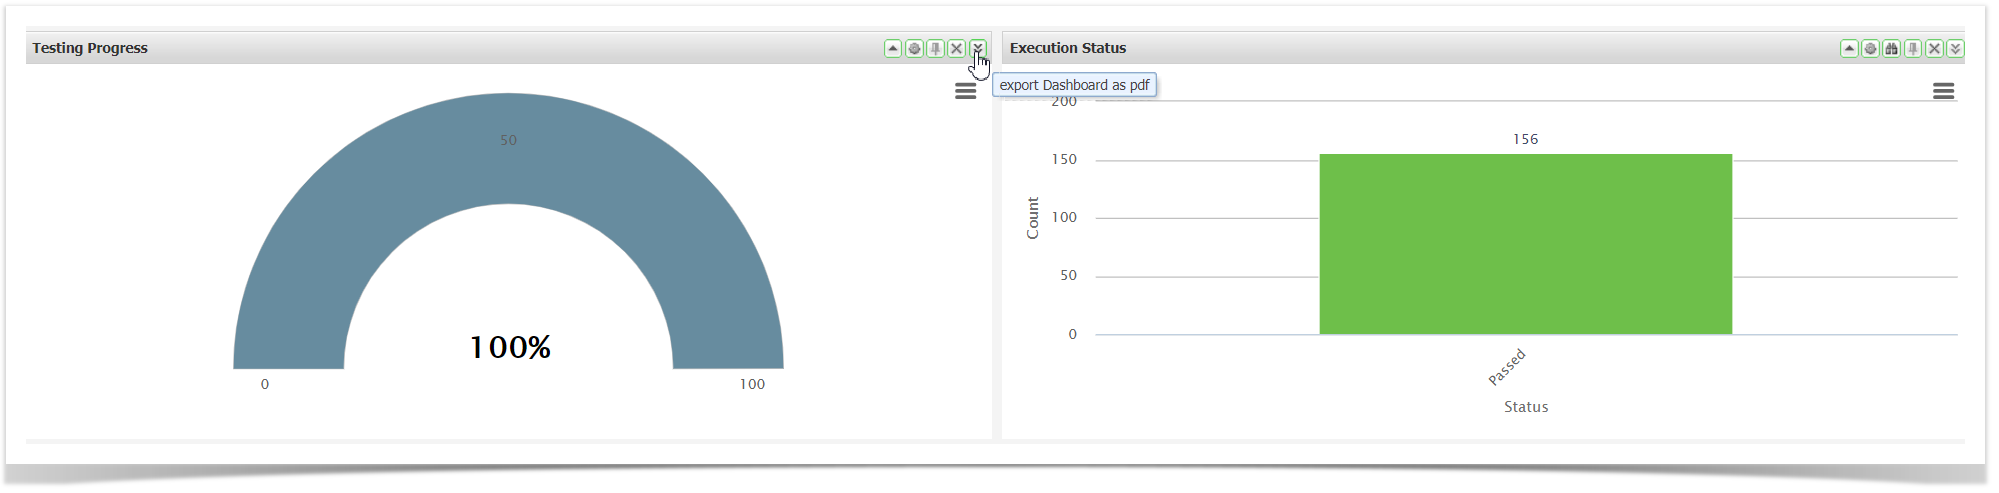
Export dashboard to PDF file:
Click on the  button on any of the portlets. This will export all gadgets on the Dashboard.
Enterprise Tester Gadget listing
Activity Streams | Allows events to be posted to the dashboard |
| Actual vs Estimated | Displays the actual versus estimated duration for script execution |
| Bar Graph | Displays a graph from underlying saved search/query criteria |
| Burndown Chart | Displays the actual versus estimated work remaining over time |
Dashboard Links | Allows fast access to other dashboards |
| Est vs Remaining Time | Displays the estimated versus remaining duration for script execution |
| Execution Script Status | Displays execution status from underlying saved search/query criteria |
| Gauge Chart | Displays a chart from underlying saved search/query criteria |
| Getting Started | Links to getting started tasks |
| Grouped Bar Graph | Displays a graph from underlying saved search/query criteria |
| Incident Numbers | Displays a graph of Incident Numbers over time |
| Incident Rate | Displays a graph of Incident Rate over time |
| Incident Status | Displays a graph of Incident Statuses |
My Notes | Allows you to add plain-text notes to the Dashboard |
| Pie Chart | Displays a chart from underlying saved search/query criteria |
Remote Content | Allows the display of content from a URL page |
| Report Chart | Classic Reports - displays charts form any of the configured reports |
| Requirement Status | Displays a graph of Requirement Status |
Rich Text | Allows editable content using a rich text editor |
Tests Completed | Displays a graph of Tests Completed |
Total Scripts Run | Displays a graph of Total Scripts Run |
Two Series Bar Graph | Displays a graph from underlying saved search/query criteria |