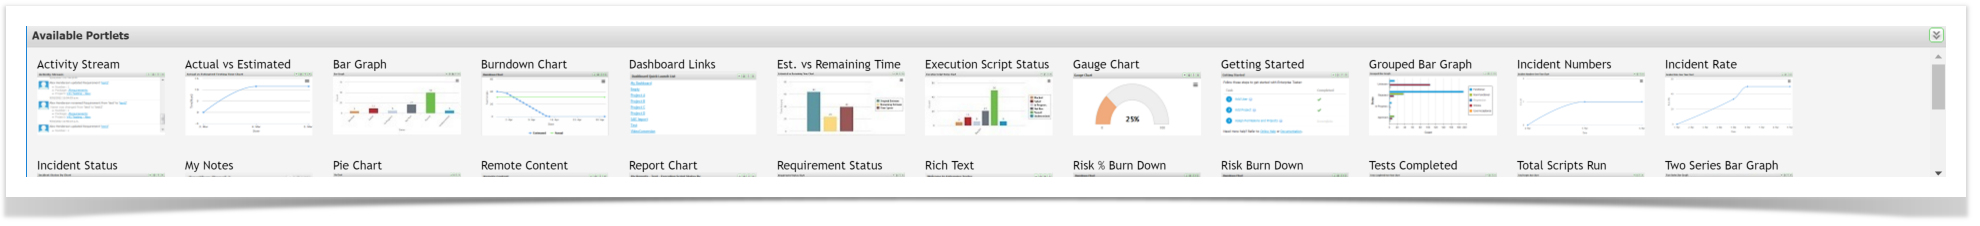
All dashboards are made up of gadgets that can be dragged onto the dashboard and then moved around as required.
The following coverage reports are available in Enterprise Tester:
- Matrix Report
- Coverage using a Bar Graph gadget
- Coverage using the Has Coverage or Provides Coverage queries.
Coverage using a Bar Graph gadget
- Create and save a query containing all the Requirements you would like to view Coverage for.
- Drag and drop the Bar Graph gadget onto your dashboard from the list of available gadgets.
- Click the
button to configure the portlet.
- Select the Query you previously saved, set the Field value to Coverage, set the Function to Count.

- Click Save for the graph to display.
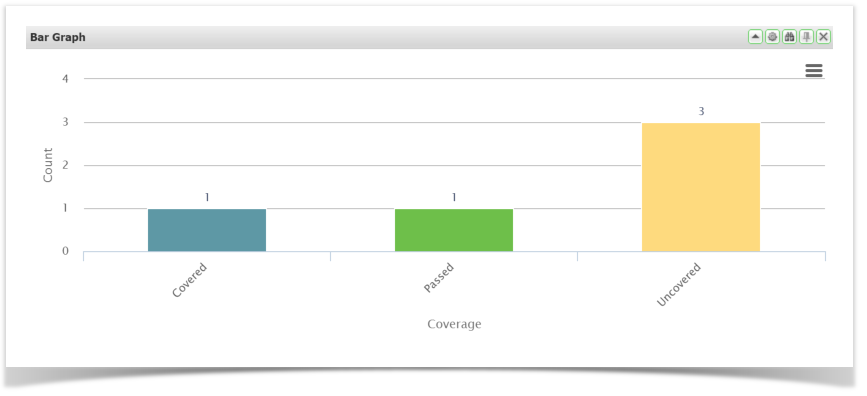
How coverage values are calculated in this report:
Requirement exists only = Uncovered
Requirement has a relationship to a Test Script or Automated Test = Covered
Requirement has a relationship to a Test Script or Automated Test, and a relationship to a Test Script Assignment (Run) or Automated Test Assignment (Run) = The actual status of the Test Run e.g passed or failed.
| Info | ||
|---|---|---|
| ||
This is an example of how Coverage can be used. Coverage is also available in other charts such as Pie, Grouped Bar Graph, Two Series Bar graph etc |
Coverage using a simple query
To find all requirements in a project that have coverage, create a query:
Project= "Project Name" AND HasCoverage = True
To find all Scripts or Automated Tests in a project that provide coverage, create a query:
Project= "Project Name" AND ProvidesCoverage = True