Risk related gadgets are available on Enterprise Tester Dashboards. See the Creating Dashboards article on how to create a dashboard and add gadgets.
Risk Gadgets
There are two gadgets available for Risk. Risk must be enabled for the related project for these gadgets to be meaningful.
Risk Monitor (%)
The Risk Monitor gadget displays the actual level of Risk (blue line) versus the acceptable level of Risk expressed as a percentage (green line).
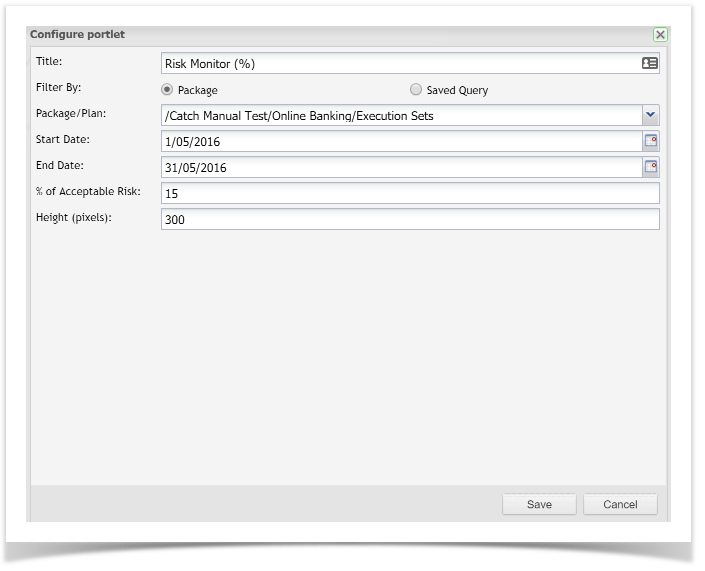
In configuration for this gadget:
- Select a package or a query containing execution data.
- Select the date range.
- Add the % of Acceptable Risk.
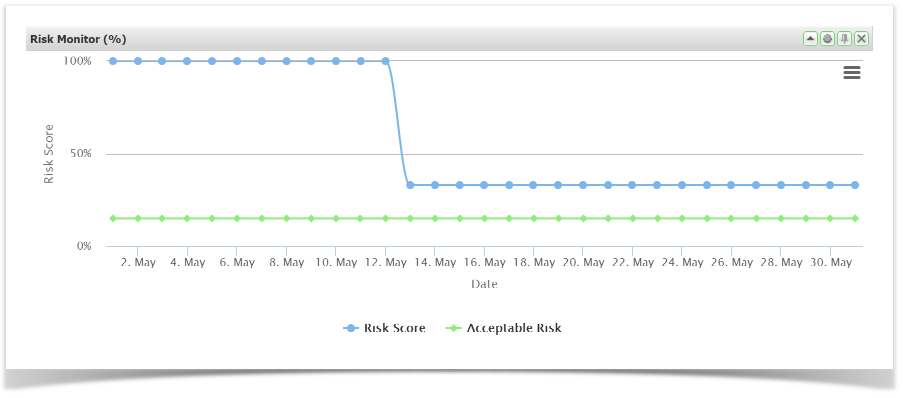
As tests are executed the actual Risk (blue line) will decrease. Testing can stop once the blue line converges with the green line.
Risk Monitor (Score)
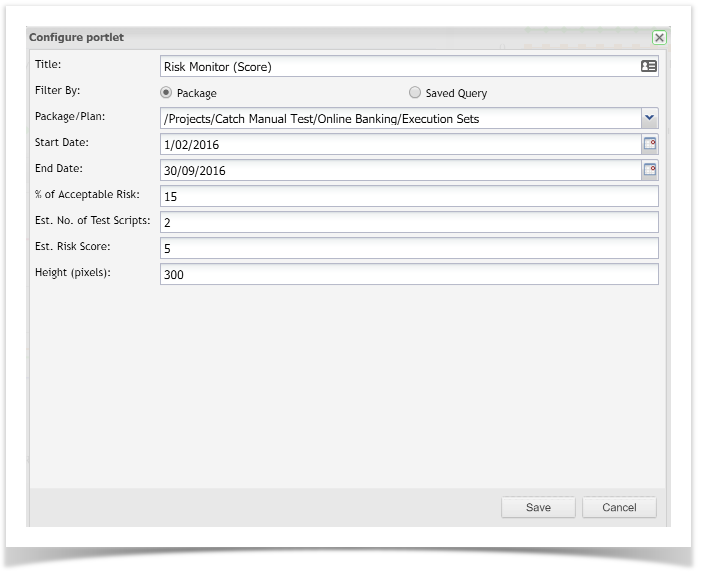
Risk Monitor (Score) can be used from the project inception - before Test Scripts have even been developed estimates can be entered to assist in developing a Risk Profile.
In configuration for this gadget:
- Select a package or a query containing execution data.
- Select the date range.
- Add the % of Acceptable Risk.
- Estimated Number of Test Scripts
- Estimated Risk Score.
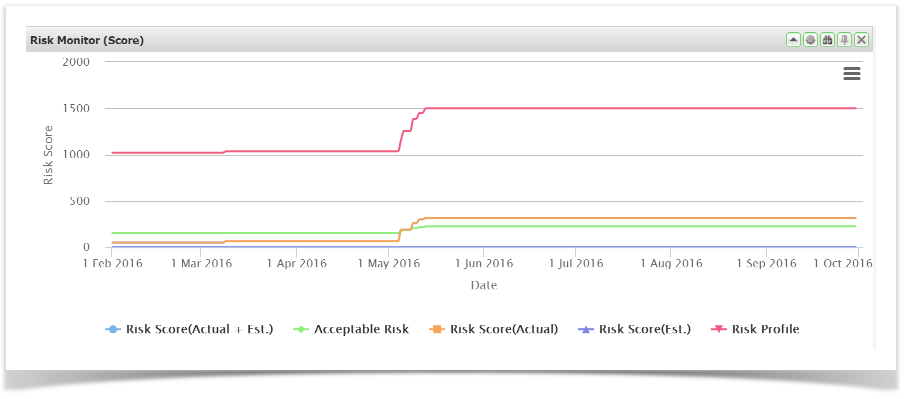
Blue Line: Risk Score (Actual + Estimated)
This is the sum of the Actual Risk Score for all execution data that is selected PLUS the total Estimated Risk score LESS the number of script assignments actually executed.
Green Line: Acceptable Risk
This is the % of Acceptable Risk as entered in the configuration screen.
Orange Line: Risk Score (Actual)
Sum of Actual Risk Score for all execution data selected. Only Script Assignments with the latest execution date are included.
Purple Line: Risk Score (Estimated)
Used in planning before Test Scripts have been developed. The Estimated Number of Test Scripts TIMES the Estimated Risk Score LESS the number of Script Assignments actually executed.
Red Line: Risk Profile
Sum of Actual Risk Score for all execution data selected PLUS the total Estimated Risk Score.